pdf 4 986 ko - Institut national de la statistique malgache (INSTAT)
pdf 4 986 ko - Institut national de la statistique malgache (INSTAT)
pdf 4 986 ko - Institut national de la statistique malgache (INSTAT)
- No tags were found...

You also want an ePaper? Increase the reach of your titles
YUMPU automatically turns print PDFs into web optimized ePapers that Google loves.
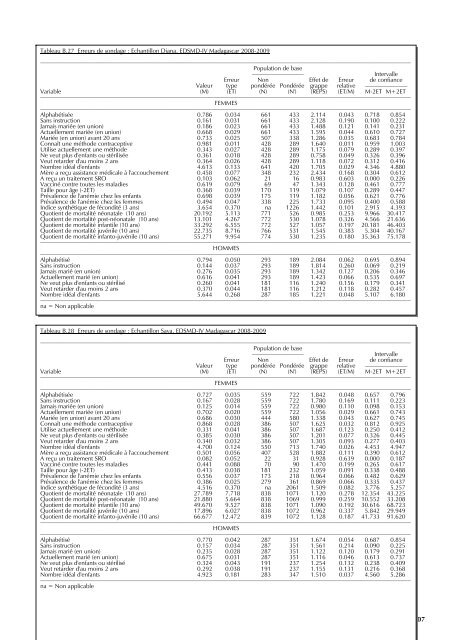
Tableau B.27 Erreurs <strong>de</strong> sondage : Échantillon Diana, EDSMD-IV Madagascar 2008-2009––––––––––––––––––––––––––––––––––––––––––––––––––––––––––––––––––––––––––––––––––––––––––––––––––––––––––––––––––––––––––Popu<strong>la</strong>tion <strong>de</strong> base––––––––––––––––– IntervalleErreur Non Effet <strong>de</strong> Erreur <strong>de</strong> confianceValeur type pondérée Pondérée grappe re<strong>la</strong>tive ––––––––––––––Variable (M) (ET) (N) (N') (REPS) (ET/M) M-2ET M+2ET––––––––––––––––––––––––––––––––––––––––––––––––––––––––––––––––––––––––––––––––––––––––––––––––––––––––––––––––––––––––––FEMMES––––––––––––––––––––––––––––––––––––––––––––––––––––––––––––––––––––––––––––––––––––––––––––––––––––––––––––––––––––––––––Alphabétisée 0.786 0.034 661 433 2.114 0.043 0.718 0.854Sans instruction 0.161 0.031 661 433 2.128 0.190 0.100 0.222Jamais mariée (en union) 0.186 0.023 661 433 1.488 0.121 0.141 0.231Actuellement mariée (en union) 0.668 0.029 661 433 1.595 0.044 0.610 0.727Mariée (en union) avant 20 ans 0.733 0.025 507 338 1.286 0.035 0.683 0.784Connaît une métho<strong>de</strong> contraceptive 0.981 0.011 428 289 1.640 0.011 0.959 1.003Utilise actuellement une métho<strong>de</strong> 0.343 0.027 428 289 1.175 0.079 0.289 0.397Ne veut plus d'enfants ou stérilisée 0.361 0.018 428 289 0.758 0.049 0.326 0.396Veut retar<strong>de</strong>r d'au moins 2 ans 0.364 0.026 428 289 1.118 0.072 0.312 0.416Nombre idéal d'enfants 4.613 0.133 641 420 1.705 0.029 4.346 4.880Mère a reçu assistance médicale à l'accouchement 0.458 0.077 348 232 2.434 0.168 0.304 0.612A reçu un traitement SRO 0.103 0.062 21 16 0.983 0.603 0.000 0.226Vacciné contre toutes les ma<strong>la</strong>dies 0.619 0.079 69 47 1.343 0.128 0.461 0.777Taille pour âge (-2ET) 0.368 0.039 170 119 1.079 0.107 0.289 0.447Prévalence <strong>de</strong> l'anémie chez les enfants 0.698 0.039 175 119 1.182 0.056 0.621 0.776Prévalence <strong>de</strong> l'anémie chez les femmes 0.494 0.047 338 225 1.733 0.095 0.400 0.588Indice synthétique <strong>de</strong> fécondité (3 ans) 3.654 0.370 na 1226 1.442 0.101 2.915 4.393Quotient <strong>de</strong> mortalité néonatale (10 ans) 20.192 5.113 771 526 0.985 0.253 9.966 30.417Quotient <strong>de</strong> mortalité post-néonatale (10 ans) 13.101 4.267 772 530 1.078 0.326 4.566 21.636Quotient <strong>de</strong> mortalité infantile (10 ans) 33.292 6.555 772 527 1.057 0.197 20.181 46.403Quotient <strong>de</strong> mortalité juvénile (10 ans) 22.735 8.716 766 531 1.545 0.383 5.304 40.167Quotient <strong>de</strong> mortalité infanto-juvénile (10 ans) 55.271 9.954 774 530 1.235 0.180 35.363 75.178––––––––––––––––––––––––––––––––––––––––––––––––––––––––––––––––––––––––––––––––––––––––––––––––––––––––––––––––––––––––––HOMMES––––––––––––––––––––––––––––––––––––––––––––––––––––––––––––––––––––––––––––––––––––––––––––––––––––––––––––––––––––––––––Alphabétisé 0.794 0.050 293 189 2.084 0.062 0.695 0.894Sans instruction 0.144 0.037 293 189 1.814 0.260 0.069 0.219Jamais marié (en union) 0.276 0.035 293 189 1.342 0.127 0.206 0.346Actuellement marié (en union) 0.616 0.041 293 189 1.423 0.066 0.535 0.697Ne veut plus d'enfants ou stérilisé 0.260 0.041 181 116 1.240 0.156 0.179 0.341Veut retar<strong>de</strong>r d'au moins 2 ans 0.370 0.044 181 116 1.212 0.118 0.282 0.457Nombre idéal d'enfants 5.644 0.268 287 185 1.221 0.048 5.107 6.180––––––––––––––––––––––––––––––––––––––––––––––––––––––––––––––––––––––––––––––––––––––––––––––––––––––––––––––––––––––––––na = Non applicableTableau B.28 Erreurs <strong>de</strong> sondage : Échantillon Sava, EDSMD-IV Madagascar 2008-2009––––––––––––––––––––––––––––––––––––––––––––––––––––––––––––––––––––––––––––––––––––––––––––––––––––––––––––––––––––––––––Popu<strong>la</strong>tion <strong>de</strong> base––––––––––––––––– IntervalleErreur Non Effet <strong>de</strong> Erreur <strong>de</strong> confianceValeur type pondérée Pondérée grappe re<strong>la</strong>tive ––––––––––––––Variable (M) (ET) (N) (N') (REPS) (ET/M) M-2ET M+2ET––––––––––––––––––––––––––––––––––––––––––––––––––––––––––––––––––––––––––––––––––––––––––––––––––––––––––––––––––––––––––FEMMES––––––––––––––––––––––––––––––––––––––––––––––––––––––––––––––––––––––––––––––––––––––––––––––––––––––––––––––––––––––––––Alphabétisée 0.727 0.035 559 722 1.842 0.048 0.657 0.796Sans instruction 0.167 0.028 559 722 1.780 0.169 0.111 0.223Jamais mariée (en union) 0.125 0.014 559 722 0.980 0.110 0.098 0.153Actuellement mariée (en union) 0.702 0.020 559 722 1.056 0.029 0.661 0.743Mariée (en union) avant 20 ans 0.686 0.030 444 580 1.338 0.043 0.627 0.745Connaît une métho<strong>de</strong> contraceptive 0.868 0.028 386 507 1.625 0.032 0.812 0.925Utilise actuellement une métho<strong>de</strong> 0.331 0.041 386 507 1.687 0.123 0.250 0.412Ne veut plus d'enfants ou stérilisée 0.385 0.030 386 507 1.201 0.077 0.326 0.445Veut retar<strong>de</strong>r d'au moins 2 ans 0.340 0.032 386 507 1.305 0.093 0.277 0.403Nombre idéal d'enfants 4.700 0.124 550 713 1.740 0.026 4.453 4.947Mère a reçu assistance médicale à l'accouchement 0.501 0.056 407 528 1.882 0.111 0.390 0.612A reçu un traitement SRO 0.082 0.052 22 31 0.928 0.639 0.000 0.187Vacciné contre toutes les ma<strong>la</strong>dies 0.441 0.088 70 90 1.470 0.199 0.265 0.617Taille pour âge (-2ET) 0.413 0.038 181 232 1.059 0.091 0.338 0.488Prévalence <strong>de</strong> l'anémie chez les enfants 0.556 0.037 173 218 0.964 0.066 0.482 0.629Prévalence <strong>de</strong> l'anémie chez les femmes 0.386 0.025 279 361 0.869 0.066 0.335 0.437Indice synthétique <strong>de</strong> fécondité (3 ans) 4.516 0.370 na 2061 1.509 0.082 3.776 5.257Quotient <strong>de</strong> mortalité néonatale (10 ans) 27.789 7.718 838 1071 1.120 0.278 12.354 43.225Quotient <strong>de</strong> mortalité post-néonatale (10 ans) 21.880 5.664 838 1069 0.999 0.259 10.552 33.208Quotient <strong>de</strong> mortalité infantile (10 ans) 49.670 9.527 838 1071 1.090 0.192 30.616 68.723Quotient <strong>de</strong> mortalité juvénile (10 ans) 17.896 6.027 838 1072 0.962 0.337 5.842 29.949Quotient <strong>de</strong> mortalité infanto-juvénile (10 ans) 66.677 12.472 839 1072 1.128 0.187 41.733 91.620––––––––––––––––––––––––––––––––––––––––––––––––––––––––––––––––––––––––––––––––––––––––––––––––––––––––––––––––––––––––––HOMMES––––––––––––––––––––––––––––––––––––––––––––––––––––––––––––––––––––––––––––––––––––––––––––––––––––––––––––––––––––––––––Alphabétisé 0.770 0.042 287 351 1.674 0.054 0.687 0.854Sans instruction 0.157 0.034 287 351 1.561 0.214 0.090 0.225Jamais marié (en union) 0.235 0.028 287 351 1.122 0.120 0.179 0.291Actuellement marié (en union) 0.675 0.031 287 351 1.116 0.046 0.613 0.737Ne veut plus d'enfants ou stérilisé 0.324 0.043 191 237 1.254 0.132 0.238 0.409Veut retar<strong>de</strong>r d'au moins 2 ans 0.292 0.038 191 237 1.155 0.131 0.216 0.368Nombre idéal d'enfants 4.923 0.181 283 347 1.510 0.037 4.560 5.286––––––––––––––––––––––––––––––––––––––––––––––––––––––––––––––––––––––––––––––––––––––––––––––––––––––––––––––––––––––––––na = Non applicableAnnexe B | 307