pdf 4 986 ko - Institut national de la statistique malgache (INSTAT)
pdf 4 986 ko - Institut national de la statistique malgache (INSTAT)
pdf 4 986 ko - Institut national de la statistique malgache (INSTAT)
- No tags were found...

You also want an ePaper? Increase the reach of your titles
YUMPU automatically turns print PDFs into web optimized ePapers that Google loves.
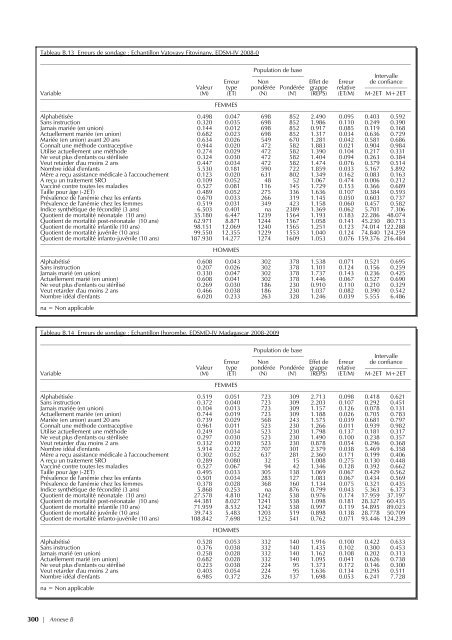
Tableau B.13 Erreurs <strong>de</strong> sondage : Échantillon Vatovavy Fitovinany, EDSM-IV 2008-0––––––––––––––––––––––––––––––––––––––––––––––––––––––––––––––––––––––––––––––––––––––––––––––––––––––––––––––––––––––––––Popu<strong>la</strong>tion <strong>de</strong> base––––––––––––––––– IntervalleErreur Non Effet <strong>de</strong> Erreur <strong>de</strong> confianceValeur type pondérée Pondérée grappe re<strong>la</strong>tive ––––––––––––––Variable (M) (ET) (N) (N') (REPS) (ET/M) M-2ET M+2ET––––––––––––––––––––––––––––––––––––––––––––––––––––––––––––––––––––––––––––––––––––––––––––––––––––––––––––––––––––––––––FEMMES––––––––––––––––––––––––––––––––––––––––––––––––––––––––––––––––––––––––––––––––––––––––––––––––––––––––––––––––––––––––––Alphabétisée 0.498 0.047 698 852 2.490 0.095 0.403 0.592Sans instruction 0.320 0.035 698 852 1.<strong>986</strong> 0.110 0.249 0.390Jamais mariée (en union) 0.144 0.012 698 852 0.917 0.085 0.119 0.168Actuellement mariée (en union) 0.682 0.023 698 852 1.317 0.034 0.636 0.729Mariée (en union) avant 20 ans 0.634 0.026 549 670 1.281 0.042 0.581 0.686Connaît une métho<strong>de</strong> contraceptive 0.944 0.020 472 582 1.883 0.021 0.904 0.984Utilise actuellement une métho<strong>de</strong> 0.274 0.029 472 582 1.390 0.104 0.217 0.331Ne veut plus d'enfants ou stérilisée 0.324 0.030 472 582 1.404 0.094 0.263 0.384Veut retar<strong>de</strong>r d'au moins 2 ans 0.447 0.034 472 582 1.474 0.076 0.379 0.514Nombre idéal d'enfants 5.530 0.181 590 722 1.859 0.033 5.167 5.892Mère a reçu assistance médicale à l'accouchement 0.123 0.020 631 802 1.349 0.162 0.083 0.163A reçu un traitement SRO 0.109 0.052 48 52 1.067 0.474 0.006 0.212Vacciné contre toutes les ma<strong>la</strong>dies 0.527 0.081 116 145 1.729 0.153 0.366 0.689Taille pour âge (-2ET) 0.489 0.052 275 336 1.636 0.107 0.384 0.593Prévalence <strong>de</strong> l'anémie chez les enfants 0.670 0.033 266 319 1.145 0.050 0.603 0.737Prévalence <strong>de</strong> l'anémie chez les femmes 0.519 0.031 349 423 1.158 0.060 0.457 0.582Indice synthétique <strong>de</strong> fécondité (3 ans) 6.503 0.401 na 2389 1.369 0.062 5.701 7.306Quotient <strong>de</strong> mortalité néonatale (10 ans) 35.180 6.447 1239 1564 1.193 0.183 22.286 48.074Quotient <strong>de</strong> mortalité post-néonatale (10 ans) 62.971 8.871 1244 1567 1.058 0.141 45.230 80.713Quotient <strong>de</strong> mortalité infantile (10 ans) 98.151 12.069 1240 1565 1.251 0.123 74.014 122.288Quotient <strong>de</strong> mortalité juvénile (10 ans) 99.550 12.355 1229 1553 1.040 0.124 74.840 124.259Quotient <strong>de</strong> mortalité infanto-juvénile (10 ans) 187.930 14.277 1274 1609 1.053 0.076 159.376 216.484––––––––––––––––––––––––––––––––––––––––––––––––––––––––––––––––––––––––––––––––––––––––––––––––––––––––––––––––––––––––––HOMMES––––––––––––––––––––––––––––––––––––––––––––––––––––––––––––––––––––––––––––––––––––––––––––––––––––––––––––––––––––––––––Alphabétisé 0.608 0.043 302 378 1.538 0.071 0.521 0.695Sans instruction 0.207 0.026 302 378 1.101 0.124 0.156 0.259Jamais marié (en union) 0.330 0.047 302 378 1.737 0.143 0.236 0.425Actuellement marié (en union) 0.608 0.041 302 378 1.446 0.067 0.527 0.690Ne veut plus d'enfants ou stérilisé 0.269 0.030 186 230 0.910 0.110 0.210 0.329Veut retar<strong>de</strong>r d'au moins 2 ans 0.466 0.038 186 230 1.037 0.082 0.390 0.542Nombre idéal d'enfants 6.020 0.233 263 328 1.246 0.039 5.555 6.486––––––––––––––––––––––––––––––––––––––––––––––––––––––––––––––––––––––––––––––––––––––––––––––––––––––––––––––––––––––––––na = Non applicableTableau B.14 Erreurs <strong>de</strong> sondage : Échantillon Ihorombe, EDSMD-IV Madagascar 2008-2009––––––––––––––––––––––––––––––––––––––––––––––––––––––––––––––––––––––––––––––––––––––––––––––––––––––––––––––––––––––––––Popu<strong>la</strong>tion <strong>de</strong> base––––––––––––––––– IntervalleErreur Non Effet <strong>de</strong> Erreur <strong>de</strong> confianceValeur type pondérée Pondérée grappe re<strong>la</strong>tive ––––––––––––––Variable (M) (ET) (N) (N') (REPS) (ET/M) M-2ET M+2ET––––––––––––––––––––––––––––––––––––––––––––––––––––––––––––––––––––––––––––––––––––––––––––––––––––––––––––––––––––––––––FEMMES––––––––––––––––––––––––––––––––––––––––––––––––––––––––––––––––––––––––––––––––––––––––––––––––––––––––––––––––––––––––––Alphabétisée 0.519 0.051 723 309 2.713 0.098 0.418 0.621Sans instruction 0.372 0.040 723 309 2.203 0.107 0.292 0.451Jamais mariée (en union) 0.104 0.013 723 309 1.157 0.126 0.078 0.131Actuellement mariée (en union) 0.744 0.019 723 309 1.188 0.026 0.705 0.783Mariée (en union) avant 20 ans 0.739 0.029 568 243 1.575 0.039 0.681 0.797Connaît une métho<strong>de</strong> contraceptive 0.961 0.011 523 230 1.266 0.011 0.939 0.982Utilise actuellement une métho<strong>de</strong> 0.249 0.034 523 230 1.798 0.137 0.181 0.317Ne veut plus d'enfants ou stérilisée 0.297 0.030 523 230 1.490 0.100 0.238 0.357Veut retar<strong>de</strong>r d'au moins 2 ans 0.332 0.018 523 230 0.878 0.054 0.296 0.368Nombre idéal d'enfants 5.914 0.222 707 301 2.379 0.038 5.469 6.358Mère a reçu assistance médicale à l'accouchement 0.302 0.052 637 281 2.360 0.171 0.199 0.406A reçu un traitement SRO 0.289 0.080 32 15 1.008 0.275 0.130 0.448Vacciné contre toutes les ma<strong>la</strong>dies 0.527 0.067 94 42 1.346 0.128 0.392 0.662Taille pour âge (-2ET) 0.495 0.033 305 138 1.069 0.067 0.429 0.562Prévalence <strong>de</strong> l'anémie chez les enfants 0.501 0.034 283 127 1.083 0.067 0.434 0.569Prévalence <strong>de</strong> l'anémie chez les femmes 0.378 0.028 368 160 1.134 0.075 0.321 0.435Indice synthétique <strong>de</strong> fécondité (3 ans) 5.868 0.253 na 876 0.799 0.043 5.363 6.373Quotient <strong>de</strong> mortalité néonatale (10 ans) 27.578 4.810 1242 538 0.976 0.174 17.959 37.197Quotient <strong>de</strong> mortalité post-néonatale (10 ans) 44.381 8.027 1241 538 1.098 0.181 28.327 60.435Quotient <strong>de</strong> mortalité infantile (10 ans) 71.959 8.532 1242 538 0.997 0.119 54.895 89.023Quotient <strong>de</strong> mortalité juvénile (10 ans) 39.743 5.483 1203 519 0.898 0.138 28.778 50.709Quotient <strong>de</strong> mortalité infanto-juvénile (10 ans) 108.842 7.698 1252 541 0.762 0.071 93.446 124.239––––––––––––––––––––––––––––––––––––––––––––––––––––––––––––––––––––––––––––––––––––––––––––––––––––––––––––––––––––––––––HOMMES––––––––––––––––––––––––––––––––––––––––––––––––––––––––––––––––––––––––––––––––––––––––––––––––––––––––––––––––––––––––––Alphabétisé 0.528 0.053 332 140 1.916 0.100 0.422 0.633Sans instruction 0.376 0.038 332 140 1.435 0.102 0.300 0.453Jamais marié (en union) 0.258 0.028 332 140 1.162 0.108 0.202 0.313Actuellement marié (en union) 0.682 0.028 332 140 1.095 0.041 0.626 0.738Ne veut plus d'enfants ou stérilisé 0.223 0.038 224 95 1.373 0.172 0.146 0.300Veut retar<strong>de</strong>r d'au moins 2 ans 0.403 0.054 224 95 1.636 0.134 0.295 0.511Nombre idéal d'enfants 6.985 0.372 326 137 1.698 0.053 6.241 7.728––––––––––––––––––––––––––––––––––––––––––––––––––––––––––––––––––––––––––––––––––––––––––––––––––––––––––––––––––––––––––na = Non applicable300 | Annexe B