evolution des performances techniques - Institut Technique de l ...
evolution des performances techniques - Institut Technique de l ...
evolution des performances techniques - Institut Technique de l ...

You also want an ePaper? Increase the reach of your titles
YUMPU automatically turns print PDFs into web optimized ePapers that Google loves.
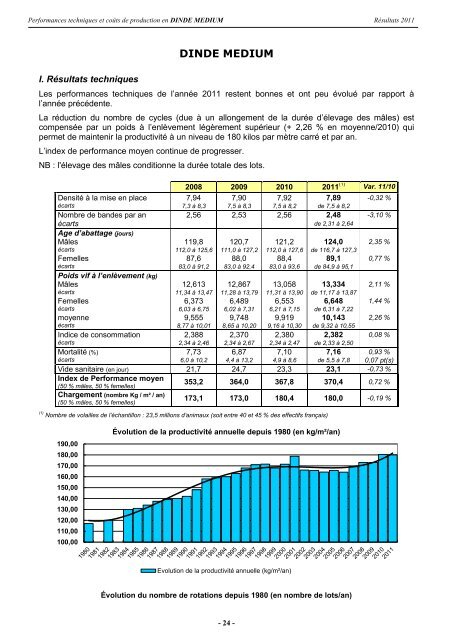
Performances <strong>techniques</strong> et coûts <strong>de</strong> production en DINDE MEDIUM Résultats 2011I. Résultats <strong>techniques</strong>DINDE MEDIUMLes <strong>performances</strong> <strong>techniques</strong> <strong>de</strong> l’année 2011 restent bonnes et ont peu évolué par rapport àl’année précé<strong>de</strong>nte.La réduction du nombre <strong>de</strong> cycles (due à un allongement <strong>de</strong> la durée d’élevage <strong><strong>de</strong>s</strong> mâles) estcompensée par un poids à l’enlèvement légèrement supérieur (+ 2,26 % en moyenne/2010) quipermet <strong>de</strong> maintenir la productivité à un niveau <strong>de</strong> 180 kilos par mètre carré et par an.L’in<strong>de</strong>x <strong>de</strong> performance moyen continue <strong>de</strong> progresser.NB : l'élevage <strong><strong>de</strong>s</strong> mâles conditionne la durée totale <strong><strong>de</strong>s</strong> lots.2008 2009 2010 2011 (1) Var. 11/10Densité à la mise en place 7,94 7,90 7,92 7,89 -0,32 %écarts 7,3 à 8,3 7,5 à 8,3 7,5 à 8,2 <strong>de</strong> 7,5 à 8,2Nombre <strong>de</strong> ban<strong><strong>de</strong>s</strong> par an 2,56 2,53 2,56 2,48 -3,10 %écarts <strong>de</strong> 2,31 à 2,64Age d’abattage (jours)Mâles 119,8 120,7 121,2 124,0 2,35 %écarts 112,0 à 125,6 111,0 à 127,2 112,0 à 127,6 <strong>de</strong> 116,7 à 127,3Femelles 87,6 88,0 88,4 89,1 0,77 %écarts 83,0 à 91,2 83,0 à 92,4 83,0 à 93,6 <strong>de</strong> 84,9 à 95,1Poids vif à l’enlèvement (kg)Mâles 12,613 12,867 13,058 13,334 2,11 %écarts 11,34 à 13,47 11,28 à 13,79 11,31 à 13,90 <strong>de</strong> 11,17 à 13,87Femelles 6,373 6,489 6,553 6,648 1,44 %écarts 6,03 à 6,75 6,02 à 7,31 6,21 à 7,15 <strong>de</strong> 6,31 à 7,22moyenne 9,555 9,748 9,919 10,143 2,26 %écarts 8,77 à 10,01 8,65 à 10,20 9,16 à 10,30 <strong>de</strong> 9,32 à 10,55Indice <strong>de</strong> consommation 2,388 2,370 2,380 2,382 0,08 %écarts 2,34 à 2,46 2,34 à 2,67 2,34 à 2,47 <strong>de</strong> 2,33 à 2,50Mortalité (%) 7,73 6,87 7,10 7,16 0,93 %écarts 6,0 à 10,2 4,4 à 13,2 4,9 à 8,6 <strong>de</strong> 5,5 à 7,8 0,07 pt(s)Vi<strong>de</strong> sanitaire (en jour) 21,7 24,7 23,3 23,1 -0,73 %In<strong>de</strong>x <strong>de</strong> Performance moyen(50 % mâles, 50 % femelles)Chargement (nombre Kg / m² / an)(50 % mâles, 50 % femelles)353,2 364,0 367,8 370,4 0,72 %173,1 173,0 180,4 180,0 -0,19 %(1) Nombre <strong>de</strong> volailles <strong>de</strong> l’échantillon : 23,5 millions d’animaux (soit entre 40 et 45 % <strong><strong>de</strong>s</strong> effectifs français)190,00180,00170,00160,00150,00140,00130,00120,00110,00100,00Évolution <strong>de</strong> la productivité annuelle <strong>de</strong>puis 1980 (en kg/m²/an)Evolution <strong>de</strong> la productivité annuelle (kg/m²/an)Évolution du nombre <strong>de</strong> rotations <strong>de</strong>puis 1980 (en nombre <strong>de</strong> lots/an)- 24 -