evolution des performances techniques - Institut Technique de l ...
evolution des performances techniques - Institut Technique de l ...
evolution des performances techniques - Institut Technique de l ...

Create successful ePaper yourself
Turn your PDF publications into a flip-book with our unique Google optimized e-Paper software.
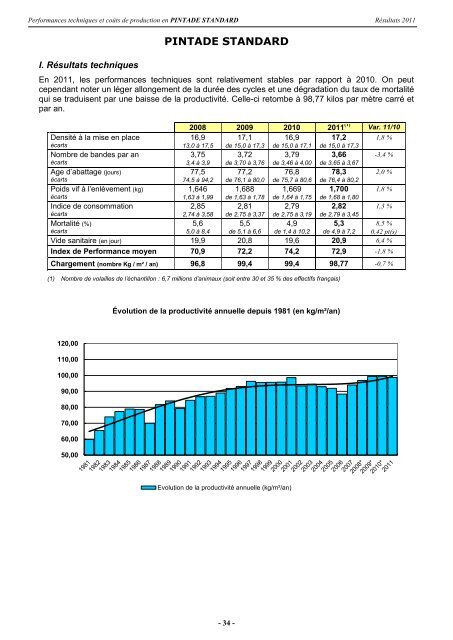
Performances <strong>techniques</strong> et coûts <strong>de</strong> production en PINTADE STANDARD Résultats 2011I. Résultats <strong>techniques</strong>PINTADE STANDARDEn 2011, les <strong>performances</strong> <strong>techniques</strong> sont relativement stables par rapport à 2010. On peutcependant noter un léger allongement <strong>de</strong> la durée <strong><strong>de</strong>s</strong> cycles et une dégradation du taux <strong>de</strong> mortalitéqui se traduisent par une baisse <strong>de</strong> la productivité. Celle-ci retombe à 98,77 kilos par mètre carré etpar an.2008 2009 2010 2011 (1) Var. 11/10Densité à la mise en place 16,9 17,1 16,9 17,2 1,8 %écarts 13,0 à 17,5 <strong>de</strong> 15,0 à 17,3 <strong>de</strong> 15,0 à 17,1 <strong>de</strong> 15,0 à 17,3Nombre <strong>de</strong> ban<strong><strong>de</strong>s</strong> par an 3,75 3,72 3,79 3,66 -3,4 %écarts 3,4 à 3,9 <strong>de</strong> 3,70 à 3,76 <strong>de</strong> 3,46 à 4,00 <strong>de</strong> 3,65 à 3,67Age d’abattage (jours) 77,5 77,2 76,8 78,3 2,0 %écarts 74,5 à 94,2 <strong>de</strong> 76,1 à 80,0 <strong>de</strong> 75,7 à 80,6 <strong>de</strong> 76,4 à 80,2Poids vif à l’enlèvement (kg) 1,646 1,688 1,669 1,700 1,8 %écarts 1,63 à 1,99 <strong>de</strong> 1,63 à 1,78 <strong>de</strong> 1,64 à 1,75 <strong>de</strong> 1,68 à 1,80Indice <strong>de</strong> consommation 2,85 2,81 2,79 2,82 1,3 %écarts 2,74 à 3,58 <strong>de</strong> 2,75 à 3,37 <strong>de</strong> 2,75 à 3,19 <strong>de</strong> 2,79 à 3,45Mortalité (%) 5,6 5,5 4,9 5,3 8,5 %écarts 5,0 à 8,4 <strong>de</strong> 5,1 à 6,6 <strong>de</strong> 1,4 à 10,2 <strong>de</strong> 4,9 à 7,2 0,42 pt(s)Vi<strong>de</strong> sanitaire (en jour) 19,9 20,8 19,6 20,9 6,4 %In<strong>de</strong>x <strong>de</strong> Performance moyen 70,9 72,2 74,2 72,9 -1,8 %Chargement (nombre Kg / m² / an) 96,8 99,4 99,4 98,77 -0,7 %(1) Nombre <strong>de</strong> volailles <strong>de</strong> l’échantillon : 6,7 millions d’animaux (soit entre 30 et 35 % <strong><strong>de</strong>s</strong> effectifs français)Évolution <strong>de</strong> la productivité annuelle <strong>de</strong>puis 1981 (en kg/m²/an)120,00110,00100,0090,0080,0070,0060,0050,00Evolution <strong>de</strong> la productivité annuelle (kg/m²/an)- 34 -