evolution des performances techniques - Institut Technique de l ...
evolution des performances techniques - Institut Technique de l ...
evolution des performances techniques - Institut Technique de l ...

Create successful ePaper yourself
Turn your PDF publications into a flip-book with our unique Google optimized e-Paper software.
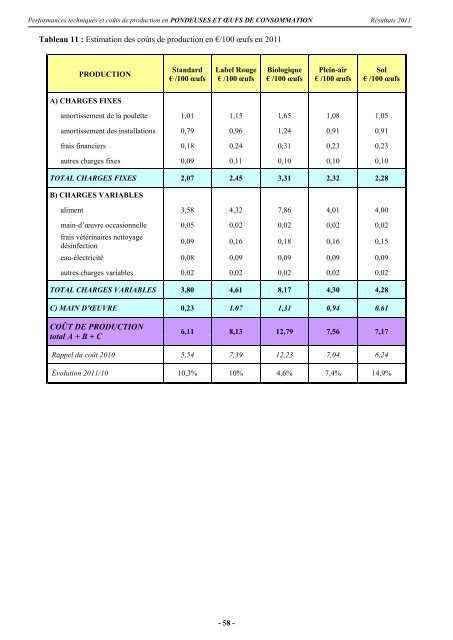
Performances <strong>techniques</strong> et coûts <strong>de</strong> production en PONDEUSES ET ŒUFS DE CONSOMMATION Résultats 2011Tableau 11 : Estimation <strong><strong>de</strong>s</strong> coûts <strong>de</strong> production en €/100 œufs en 2011PRODUCTIONStandard€ /100 œufsLabel Rouge€ /100 œufsBiologique€ /100 œufsPlein-air€ /100 œufsSol€ /100 œufsA) CHARGES FIXESamortissement <strong>de</strong> la poulette 1,01 1,15 1,65 1,08 1,05amortissement <strong><strong>de</strong>s</strong> installations 0,79 0,96 1,24 0,91 0,91frais financiers 0,18 0,24 0,31 0,23 0,23autres charges fixes 0,09 0,11 0,10 0,10 0,10TOTAL CHARGES FIXES 2,07 2,45 3,31 2,32 2,28B) CHARGES VARIABLESaliment 3,58 4,32 7,86 4,01 4,00main-d’œuvre occasionnelle 0,05 0,02 0,02 0,02 0,02frais vétérinaires nettoyagedésinfection0,09 0,16 0,18 0,16 0,15eau-électricité 0,08 0,09 0,09 0,09 0,09autres charges variables 0,02 0,02 0,02 0,02 0,02TOTAL CHARGES VARIABLES 3,80 4,61 8,17 4,30 4,28C) MAIN D’ŒUVRE 0,23 1.07 1,31 0,94 0.61COÛT DE PRODUCTIONtotal A + B + C6,11 8,13 12,79 7,56 7,17Rappel du coût 2010 5,54 7,39 12,23 7,04 6,24Évolution 2011/10 10,3% 10% 4,6% 7,4% 14,9%- 58 -