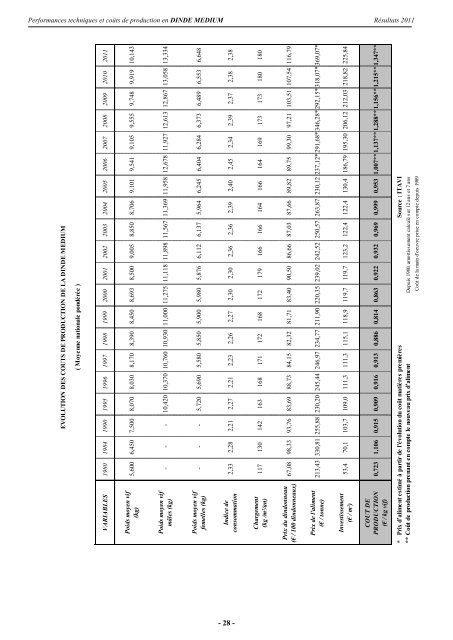
Performances <strong>techniques</strong> et coûts <strong>de</strong> production en DINDE MEDIUM Résultats 2011EVOLUTION DES COUTS DE PRODUCTION DE LA DINDE MEDIUM( Moyenne nationale pondérée )VARIABLES 1980 1984 1990 1995 1996 1997 1998 1999 2000 2001 2002 2003 2004 2005 2006 2007 2008 2009 2010 2011Poids moyen vif(kg)5,600 6,450 7,500 8,070 8,030 8,170 8,390 8,450 8,693 8,500 9,005 8,850 8,706 9,101 9,541 9,105 9,555 9,748 9,919 10,143Poids moyen vifmâles (kg)- - - 10,420 10,370 10,760 10,930 11,000 11,275 11,118 11,898 11,567 11,369 11,958 12,678 11,927 12,613 12,867 13,058 13,334Poids moyen viffemelles (kg)- - - 5,720 5,690 5,580 5,850 5,900 5,980 5,876 6,112 6,137 5,964 6,245 6,404 6,284 6,373 6,489 6,553 6,648Indice <strong>de</strong>consommation2,33 2,28 2,21 2,27 2,21 2,23 2,26 2,27 2,30 2,30 2,36 2,36 2,39 2,40 2,45 2,34 2,39 2,37 2,38 2,38Chargement(kg /m²/an)117 130 142 163 168 171 172 168 172 179 166 166 164 166 164 169 173 173 180 180Prix du dindonneau(€ / 100 dindonneaux)67,08 98,33 93,76 83,69 88,73 84,15 82,32 81,71 83,40 90,50 86,66 87,03 87,66 89,82 89,75 99,30 97,21 103,51 107,54 116,79Prix <strong>de</strong> l'aliment(€ / tonne)213,43 330,81 255,88 230,20 245,44 246,97 234,77 211,90 220,35 239,02 242,52 250,57 263,87 230,12 237,12* 291,68* 346,28* 292,15* 318,07* 369,07*Investissement(€ / m²)53,4 70,1 103,7 109,0 111,3 111,3 115,1 118,9 119,7 119,7 123,2 122,4 122,4 130,4 186,79 195,30 206,12 212,03 218,82 225,84COUT DEPRODUCTION(€ / kg vif)0,723 1,106 0,915 0,909 0,916 0,913 0,886 0,814 0,863 0,922 0,932 0,969 0,999 0,953 1,007** 1,137** 1,288** 1,156** 1,215** 1,347*** Prix d’aliment estimé à partir <strong>de</strong> l'évolution du coût matières premières Source : ITAVI** Coût <strong>de</strong> production prenant en compte le nouveau prix d’aliment Depuis 1980, amortissement calculé sur 12 ans et 7 ansCoût <strong>de</strong> la main d'oeuvre prise en compte <strong>de</strong>puis 1989- 28 -
Performances <strong>techniques</strong> et coûts <strong>de</strong> production en CANARD A ROTIR Résultats 2011CANARD A ROTIRI. Résultats <strong>techniques</strong>La productivité est relativement stable en 2011 par rapport à 2010, après plusieurs années <strong>de</strong> forteprogression. Ce ralentissement <strong>de</strong> la productivité est à rapprocher avec une légère augmentation<strong><strong>de</strong>s</strong> durées <strong>de</strong> vi<strong>de</strong> sanitaire. Elle atteint toutefois un niveau <strong>de</strong> 194,8 kilos par mètre carré et par an,plus haute valeur <strong><strong>de</strong>s</strong> quinze <strong>de</strong>rnières années. La <strong>de</strong>nsité à la mise en place dépasse les15 animaux par mètre carré.2008 2009 2010 2011 (1) Var. 11/10Densité à la mise en place 14,7 14,9 14,8 15,1 1,86 %écarts 11,0 à 15,9 13,9 à 15,7 12,9 à 15,8 <strong>de</strong> 13,7 à 15,9Nombre <strong>de</strong> ban<strong><strong>de</strong>s</strong> par an 3,52 3,44 3,48 3,44 -0,99 %écarts <strong>de</strong> 3,39 à 3,83 <strong>de</strong> 3,33 à 3,76 <strong>de</strong> 3,00 à 3,78 <strong>de</strong> 3,34 à 3,70Age d’abattage (jours)mâles 84,3 84,4 84,1 83,7 -0,44 %écarts 82,6 à 86,7 82,9 à 84,8 81,3 à 85,0 <strong>de</strong> 82,1 à 84,4femelles 70,1 70,2 70,2 69,5 -1,05 %écarts 67,7 à 73,3 69,0 à 71,5 69,0 à 71,4 <strong>de</strong> 68,3 à 70,7Poids vif à l’enlèvement (kg)mâles 4,630 4,635 4,640 4,655 0,34 %écarts 4,44 à 5,12 4,52 à 4,95 4,50 à 5,01 <strong>de</strong> 4,54 à 4,99femelles 2,530 2,523 2,536 2,541 0,20 %écarts 2,42 à 2,76 2,44 à 2,75 2,43 à 2,74 <strong>de</strong> 2,44 à 2,76moyenne 3,785 3,909 3,960 3,980 0,51 %écarts 3,47 à 4,23 3,66 à 4,03 3,51 à 4,15 <strong>de</strong> 3,74 à 4,19Indice <strong>de</strong> consommation 2,776 2,784 2,757 2,725 -1,19 %écarts 2,73 à 3,01 2,66 à 2,82 2,68 à 3,00 <strong>de</strong> 2,66 à 2,83Mortalité (%) 3,6 4,1 3,7 3,7 2,00 %écarts 3,0 à 6,1 3,0 à 4,9 2,8 à 8,5 <strong>de</strong> 2,6 à 6,3 0,07 pt(s)Vi<strong>de</strong> sanitaire (en jour) 19,6 21,9 21,5 22,4 4,40 %In<strong>de</strong>x <strong>de</strong> Performances moyen 167,6 172,1 174,8 177,7 1,65 %Chargement (nombre Kg / m² / an) 183,6 187,1 193,2 194,8 0,86 %(1) Nombre <strong>de</strong> volailles <strong>de</strong> l’échantillon : 21,4 millions d’animaux (soit entre 50 et 55% <strong><strong>de</strong>s</strong> effectifs français)Évolution <strong>de</strong> la productivité annuelle <strong>de</strong>puis 1995 (en kg/m²/an)200,00190,00180,00170,00160,00150,00140,00130,00120,00110,00Evolution <strong>de</strong> la productivité annuelle (kg/m²/an)Poly. (Evolution <strong>de</strong> la productivité annuelle (kg/m²/an))- 29 -