Fresh Point Magazine - B2B24 - Il Sole 24 Ore
Fresh Point Magazine - B2B24 - Il Sole 24 Ore
Fresh Point Magazine - B2B24 - Il Sole 24 Ore

Create successful ePaper yourself
Turn your PDF publications into a flip-book with our unique Google optimized e-Paper software.
saving units produced by GNA, and Tecnoceam,<br />
which makes labour-saving corer and slicer lines.<br />
Recession spells market downswing<br />
The fresh-cut market as a whole has posted explosive<br />
growth rates over the last decade, and today Italy is<br />
the second largest market in Europe behind the UK.<br />
According to Ismea-Nielsen survey data, the industry<br />
posted its first, and only, minus signs, albeit to a very<br />
limited extent, only in 2008, when volumes were off<br />
1.4% and receipts slid 3.8%. The performance had<br />
competitors and rivals scrambling to find the right<br />
response, a situation that led some to revisit their<br />
marketing strategies and pricing policies and others<br />
to accelerate pursuit of suitable alliances with big<br />
retail. Yet by the following year the market had<br />
rebounded considerably, with receipts up 5.8% for a<br />
€700 million turnover and sales volumes at 146 thousand<br />
tons, up a solid 11% on the year.<br />
A number of reasons can be adduced for the trade’s hiccup,<br />
some arising from external factors like the global<br />
financial meltdown and others from internal sources like<br />
efficiency-induced restructuring in the supply chain.<br />
For example, it’s easy to see that the recession-buffeted<br />
economy led consumers to seek out lower-priced<br />
items of similar kind. Note in this connection that<br />
among the rate variations from 2005 to 2009 shown in<br />
Table 1 fresh-cut sales fell in 2008 whereas turnover of<br />
fresh and frozen vegetables rose. Even if some market<br />
surveys suggest that the price factor has little influence<br />
on consumer preferences, it is likely that a fair<br />
share of the consuming public decided to buy fresh<br />
bulk produce in times of a pinched economy.<br />
Yet despite this line of reasoning, the following year<br />
saw fresh-cut vegetable items posting a solid performance<br />
in terms of both volume and receipts. This<br />
was a sure signal showing that in actual fact the<br />
industry proved to be resilient enough to respond rapidly<br />
to ebb and flow of market forces.<br />
The lion’s share of the fresh-cut trade today goes to<br />
salads, with a market share of 86% in 2009, followed<br />
by heat’n’eat, raw and dressed bowls of vegetables<br />
with 9%, 4% and 2% shares, respectively.<br />
Most of the fresh-cut salad sales belong to crispy<br />
mixed items at 34%, even though single-portions of<br />
rocket, baby leaf and garden valerian together combine<br />
for a 35% share and have been the trade’s most<br />
dynamic sector for several years now (Fig. 2).<br />
Figure 3 shows that consumer demand in Italy is<br />
mostly located in the northwest quadrant, which<br />
accounts for 41% of receipts and 40% of volume.<br />
While the South still represents no more than 12% in<br />
turnover and 13% in volume, the last few years have<br />
seen regions in the South gain in both categories. In<br />
effect, Ismea-Nielsen survey data show that fresh-cut<br />
items accounted for 2.7% of all vegetable purchases<br />
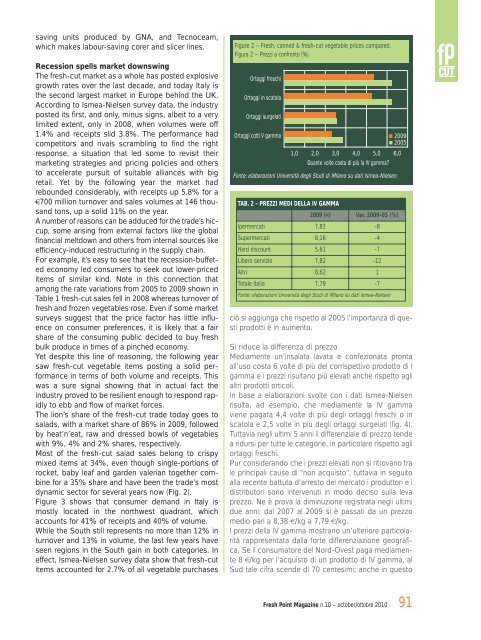
Figure 2 – <strong>Fresh</strong>, canned & fresh-cut vegetable prices compared.<br />
Figura 2 – Prezzi a confronto (%).<br />
Ortaggi freschi<br />
Ortaggi in scatola<br />
Ortaggi surgelati<br />
Ortaggi cotti V gamma<br />
1,0<br />
TAB. 2 - PREZZI MEDI DELLA IV GAMMA<br />
2,0 3,0 4,0 5,0 6,0<br />
Quante volte costa di più la IV gamma?<br />
Fonte: elaborazioni Università degli Studi di Milano su dati Ismea-Nielsen<br />
2009 (€) Var. 2009-05 (%)<br />
Ipermercati 7,83 -8<br />
Supermercati 8,16 -4<br />
Hard discount 5,61 -7<br />
Libero servizio 7,82 -12<br />
Altri 8,62 1<br />
Totale Italia 7,79 -7<br />
Fonte: elaborazioni Università degli Studi di Milano su dati Ismea-Nielsen<br />
ciò si aggiunga che rispetto al 2005 l’importanza di questi<br />
prodotti è in aumento.<br />
Si riduce la differenza di prezzo<br />
Mediamente un’insalata lavata e confezionata pronta<br />
all’uso costa 6 volte di più del corrispettivo prodotto di I<br />
gamma e i prezzi risultano più elevati anche rispetto agli<br />
altri prodotti orticoli.<br />
In base a elaborazioni svolte con i dati Ismea-Nielsen<br />
risulta, ad esempio, che mediamente la IV gamma<br />
viene pagata 4,4 volte di più degli ortaggi freschi o in<br />
scatola e 2,5 volte in più degli ortaggi surgelati (fig. 4).<br />
Tuttavia negli ultimi 5 anni il differenziale di prezzo tende<br />
a ridursi per tutte le categorie, in particolare rispetto agli<br />
ortaggi freschi.<br />
Pur considerando che i prezzi elevati non si ritrovano tra<br />
le principali cause di “non acquisto”, tuttavia in seguito<br />
alla recente battuta d’arresto del mercato i produttori e i<br />
distributori sono intervenuti in modo deciso sulla leva<br />
prezzo. Ne è prova la diminuzione registrata negli ultimi<br />
due anni: dal 2007 al 2009 si è passati da un prezzo<br />
medio pari a 8,38 €/kg a 7,79 €/kg.<br />
I prezzi della IV gamma mostrano un’ulteriore particolarità<br />
rappresentata dalla forte differenziazione geografica.<br />
Se il consumatore del Nord-Ovest paga mediamente<br />
8 €/kg per l’acquisto di un prodotto di IV gamma, al<br />
Sud tale cifra scende di 70 centesimi; anche in questo<br />
<strong>Fresh</strong> <strong>Point</strong> <strong>Magazine</strong> n.10 – october/ottobre 2010<br />
2009<br />
2005<br />
91