LEADER e distretti rurali - Inea
LEADER e distretti rurali - Inea
LEADER e distretti rurali - Inea

You also want an ePaper? Increase the reach of your titles
YUMPU automatically turns print PDFs into web optimized ePapers that Google loves.
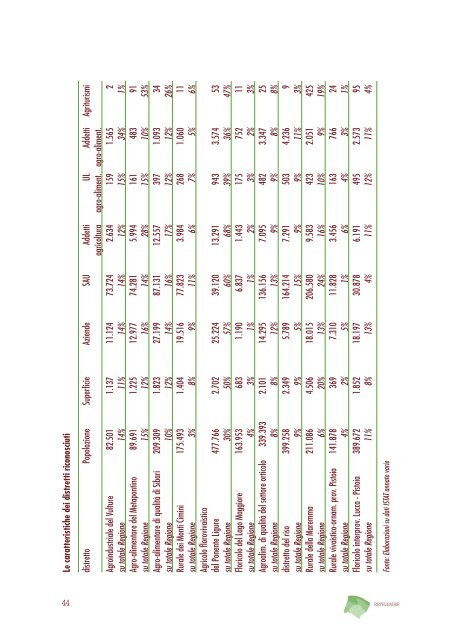
Le caratteristiche dei <strong>distretti</strong> riconosciutidistretto Popolazione Superficie Aziende SAU Addetti UL Addetti Agriturismiagricoltura agro-aliment. agro-aliment.Agroindustriale del Vulture 82.501 1.137 11.124 73.724 2.634 159 1.565 2su totale Regione 14% 11% 14% 14% 12% 15% 34% 1%Agro-alimentare del Metapontino 89.691 1.225 12.977 74.281 5.994 161 483 91su totale Regione 15% 12% 16% 14% 28% 15% 10% 53%Agro-alimentare di qualità di Sibari 209.309 1.823 27.199 87.131 12.557 397 1.093 34su totale Regione 10% 12% 14% 16% 17% 12% 12% 26%Rurale dei Monti Cimini 175.493 1.404 19.516 77.823 3.984 268 1.060 11su totale Regione 3% 8% 9% 11% 6% 7% 5% 6%Agricolo florovivaisticodel Ponente Ligure 477.766 2.702 25.224 39.120 13.291 943 3.574 53su totale Regione 30% 50% 57% 60% 68% 39% 36% 47%Floricolo del Lago Maggiore 163.953 683 1.190 6.837 1.443 175 752 11su totale Regione 4% 3% 1% 1% 2% 3% 2% 3%Agroalim. di qualità del settore orticolo 339.393 2.101 14.295 136.156 7.095 482 3.347 25su totale Regione 8% 8% 12% 13% 9% 9% 8% 8%distretto del riso 399.258 2.349 5.789 164.214 7.291 503 4.236 9su totale Regione 9% 9% 5% 15% 9% 9% 11% 3%Rurale della Maremma 211.086 4.506 18.015 206.580 9.583 423 2.051 425su totale Regione 6% 20% 13% 24% 16% 10% 9% 19%Rurale vivaistico-ornam. prov. Pistoia 141.878 369 7.310 11.828 3.456 163 766 24su totale Regione 4% 2% 5% 1% 6% 4% 3% 1%Floricolo interprov. Lucca - Pistoia 389.672 1.852 18.197 30.878 6.191 495 2.573 95su totale Regione 11% 8% 13% 4% 11% 12% 11% 4%Fonte: Elaborazioni su dati ISTAT annate varie44 RETE<strong>LEADER</strong>