In Fonderia 6 2023
Sesto numero del 2023 di In Fonderia
Sesto numero del 2023 di In Fonderia

Create successful ePaper yourself
Turn your PDF publications into a flip-book with our unique Google optimized e-Paper software.
0,6%<br />
0,6%<br />
3,9%<br />
1,9%<br />
6,0%<br />
-0,6%<br />
-1,8%<br />
IN PRIMO PIANO<br />
-0,6%<br />
-1,8%-12,3%<br />
Acciaio Alluminio Ghisa Superleghe Zinco e Altri nf<br />
Steel Aluminiun Cast iron Superalloys Zinc and other nf<br />
2021 2022 -12,3%<br />
Acciaio Alluminio Ghisa Superleghe Zinco e Altri nf<br />
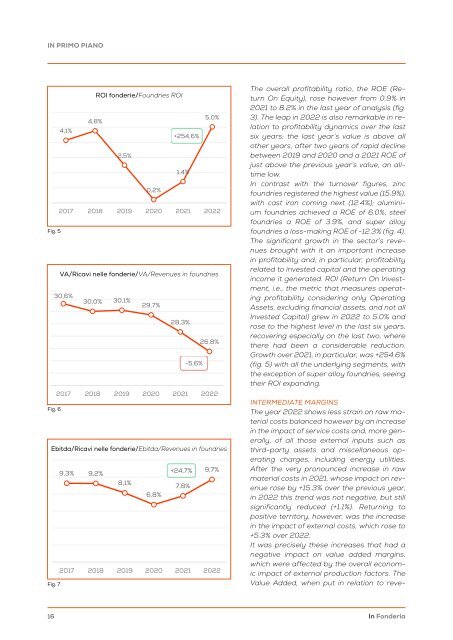
Steel Aluminiun Cast iron Superalloys Zinc The and overall other nf profitability ratio, the ROE (Return<br />
On Equity), rose however from 0.9% in<br />
ROI fonderie ROI fonderie/Foundries ROI<br />
2021 2022<br />
2021 to 8.2% in the last year of analysis (fig.<br />
ROI fonderie<br />
5,0% 3). The leap in 2022 is also remarkable in relation<br />
to profitability dynamics over the last<br />
4,8%<br />
4,1%<br />
+254,6%<br />
six years: the last year’s value is above all<br />
4,8%<br />
5,0% other years, after two years of rapid decline<br />
4,1%<br />
2,5%<br />
between 2019 and 2020 and a 2021 ROE of<br />
+254,6%<br />
just above the previous year’s value, an alltime<br />
1,4%<br />
low.<br />
2,5%<br />
<strong>In</strong> contrast with the turnover figures, zinc<br />
0,2%<br />
foundries registered the highest value (15.9%),<br />
2017 2018 2019 2020<br />
0,2%<br />
1,4%<br />
2021 2022<br />
with cast iron coming next (12.4%); aluminium<br />
foundries achieved a ROE of 6.0%, steel<br />
foundries a ROE of 3.9%, and super alloy<br />
VA/Ricavi Fig. 5 nelle fonderie<br />
foundries a loss-making ROE of -12.3% (fig. 4).<br />
2017 2018 2019 2020 2021 2022 The significant growth in the sector’s revenues<br />
brought with it an important increase<br />
VA/Ricavi in profitability and, in particular, profitability<br />
30,6% nelle fonderie<br />
30,0% 30,1%<br />
related to invested capital and the operating<br />
VA/Ricavi nelle fonderie/VA/Revenues 29,7% in foundries<br />
income it generated. ROI (Return On <strong>In</strong>vestment,<br />
28,3%<br />
i.e., the metric that measures operat-<br />
30,6%<br />
ing profitability considering only Operating<br />
30,0% 30,1%<br />
29,7%<br />
26,8% Assets, excluding financial assets, and not all<br />
<strong>In</strong>vested Capital) grew in 2022 to 5.0% and<br />
28,3%<br />
rose to the highest level in the last six years,<br />
-5,6%<br />
recovering especially on the last two, where<br />
26,8%<br />
there had been a considerable reduction.<br />
2017 2018 2019 2020<br />
Growth over 2021, in particular, was +254.6%<br />
2021 2022<br />
-5,6%<br />
(fig. 5) with all the underlying segments, with<br />
the exception of super alloy foundries, seeing<br />
their ROI expanding.<br />
Fig. 6<br />
2017 2018 2019 2020 2021 2022<br />
Ebitda/Ricavi nelle fonderie<br />
Ebitda/Ricavi nelle fonderie/Ebitda/Revenues in foundries<br />
Fig. 7<br />
9,3% 9,2%<br />
Debt/Equity Fonderie<br />
8,1%<br />
6,8%<br />
+24,7%<br />
7,8%<br />
9,7%<br />
2017 2018 2019 2020 2021 2022<br />
<br />
INTERMEDIATE MARGINS<br />
The year 2022 shows less strain on raw material<br />
costs balanced however by an increase<br />
in the impact of service costs and, more generally,<br />
of all those external inputs such as<br />
third-party assets and miscellaneous operating<br />
charges, including energy utilities.<br />
After the very pronounced increase in raw<br />
material costs in 2021, whose impact on revenue<br />
rose by +15.3% over the previous year,<br />
in 2022 this trend was not negative, but still<br />
significantly reduced (+1.1%). Returning to<br />
positive territory, however, was the increase<br />
in the impact of external costs, which rose to<br />
+5.3% over 2022.<br />
It was precisely these increases that had a<br />
negative impact on value added margins,<br />
which were affected by the overall economic<br />
impact of external production factors. The<br />
Value Added, when put in relation to reve-<br />
16<br />
1,44 1,44<br />
1,45<br />
1,44<br />
1,41<br />
<strong>In</strong> <strong>Fonderia</strong>