

download pdf - Vlaams Instituut voor de Zee
download pdf - Vlaams Instituut voor de Zee
download pdf - Vlaams Instituut voor de Zee

Create successful ePaper yourself
Turn your PDF publications into a flip-book with our unique Google optimized e-Paper software.
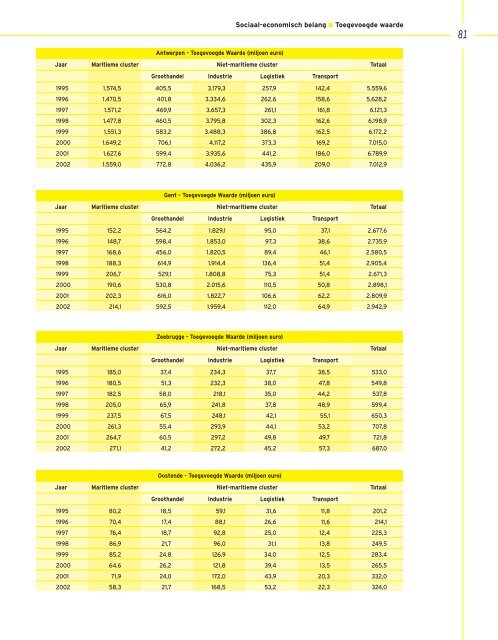
Antwerpen - Toegevoeg<strong>de</strong> Waar<strong>de</strong> (miljoen euro)<br />
Sociaal-economisch belang ■ Toegevoeg<strong>de</strong> waar<strong>de</strong><br />
Jaar Maritieme cluster Niet-maritieme cluster Totaal<br />
Groothan<strong>de</strong>l Industrie Logistiek Transport<br />
1995 1.574,5 405,5 3.179,3 257,9 142,4 5.559,6<br />
1996 1.470,5 401,8 3.334,6 262,6 158,6 5.628,2<br />
1997 1.571,2 469,9 3.657,3 261,1 161,8 6.121,3<br />
1998 1.477,8 460,5 3.795,8 302,3 162,6 6.198,9<br />
1999 1.551,3 583,2 3.488,3 386,8 162,5 6.172,2<br />
2000 1.649,2 706,1 4.117,2 373,3 169,2 7.015,0<br />
2001 1.627,6 599,4 3.935,6 441,2 186,0 6.789,9<br />
2002 1.559,0 772,8 4.036,2 435,9 209,0 7.012,9<br />
Gent - Toegevoeg<strong>de</strong> Waar<strong>de</strong> (miljoen euro)<br />
Jaar Maritieme cluster Niet-maritieme cluster Totaal<br />
Groothan<strong>de</strong>l Industrie Logistiek Transport<br />
1995 152,2 564,2 1.829,1 95,0 37,1 2.677,6<br />
1996 148,7 598,4 1.853,0 97,3 38,6 2.735,9<br />
1997 168,6 456,0 1.820,5 89,4 46,1 2.580,5<br />
1998 188,3 614,9 1.914,4 136,4 51,4 2.905,4<br />
1999 206,7 529,1 1.808,8 75,3 51,4 2.671,3<br />
2000 190,6 530,8 2.015,6 110,5 50,8 2.898,1<br />
2001 202,3 616,0 1.822,7 106,6 62,2 2.809,9<br />
2002 214,1 592,5 1.959,4 112,0 64,9 2.942,9<br />
<strong>Zee</strong>brugge - Toegevoeg<strong>de</strong> Waar<strong>de</strong> (miljoen euro)<br />
Jaar Maritieme cluster Niet-maritieme cluster Totaal<br />
Groothan<strong>de</strong>l Industrie Logistiek Transport<br />
1995 185,0 37,4 234,3 37,7 38,5 533,0<br />
1996 180,5 51,3 232,3 38,0 47,8 549,8<br />
1997 182,5 58,0 218,1 35,0 44,2 537,8<br />
1998 205,0 65,9 241,8 37,8 48,9 599,4<br />
1999 237,5 67,5 248,1 42,1 55,1 650,3<br />
2000 261,3 55,4 293,9 44,1 53,2 707,8<br />
2001 264,7 60,5 297,2 49,8 49,7 721,8<br />
2002 271,1 41,2 272,2 45,2 57,3 687,0<br />
Oosten<strong>de</strong> - Toegevoeg<strong>de</strong> Waar<strong>de</strong> (miljoen euro)<br />
Jaar Maritieme cluster Niet-maritieme cluster Totaal<br />
Groothan<strong>de</strong>l Industrie Logistiek Transport<br />
1995 80,2 18,5 59,1 31,6 11,8 201,2<br />
1996 70,4 17,4 88,1 26,6 11,6 214,1<br />
1997 76,4 18,7 92,8 25,0 12,4 225,3<br />
1998 86,9 21,7 96,0 31,1 13,8 249,5<br />
1999 85,2 24,8 126,9 34,0 12,5 283,4<br />
2000 64,6 26,2 121,8 39,4 13,5 265,5<br />
2001 71,9 24,0 172,0 43,9 20,3 332,0<br />
2002 58,3 21,7 168,5 53,2 22,3 324,0<br />
81


