Qualification of the Assembly Process of Flip-Chip BGA Packages ...
Qualification of the Assembly Process of Flip-Chip BGA Packages ...
Qualification of the Assembly Process of Flip-Chip BGA Packages ...

You also want an ePaper? Increase the reach of your titles
YUMPU automatically turns print PDFs into web optimized ePapers that Google loves.
6.1 Results<br />
Texas Tech University, Nivetha Shivan, May 2012<br />
CHAPTER 6<br />
DATA AND ANALYSIS<br />
6.1.1 Pre-engineering <strong>Qualification</strong> Phase I<br />
6.1.1.1 Stress Test Results<br />
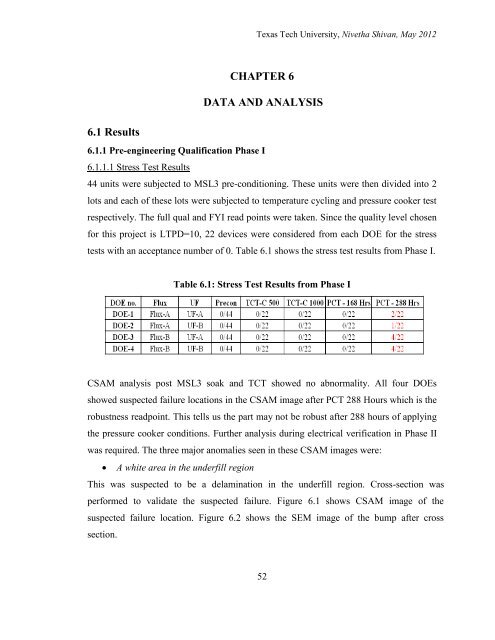
44 units were subjected to MSL3 pre-conditioning. These units were <strong>the</strong>n divided into 2<br />
lots and each <strong>of</strong> <strong>the</strong>se lots were subjected to temperature cycling and pressure cooker test<br />
respectively. The full qual and FYI read points were taken. Since <strong>the</strong> quality level chosen<br />
for this project is LTPD=10, 22 devices were considered from each DOE for <strong>the</strong> stress<br />
tests with an acceptance number <strong>of</strong> 0. Table 6.1 shows <strong>the</strong> stress test results from Phase I.<br />
Table 6.1: Stress Test Results from Phase I<br />
CSAM analysis post MSL3 soak and TCT showed no abnormality. All four DOEs<br />
showed suspected failure locations in <strong>the</strong> CSAM image after PCT 288 Hours which is <strong>the</strong><br />
robustness readpoint. This tells us <strong>the</strong> part may not be robust after 288 hours <strong>of</strong> applying<br />
<strong>the</strong> pressure cooker conditions. Fur<strong>the</strong>r analysis during electrical verification in Phase II<br />
was required. The three major anomalies seen in <strong>the</strong>se CSAM images were:<br />
� A white area in <strong>the</strong> underfill region<br />
This was suspected to be a delamination in <strong>the</strong> underfill region. Cross-section was<br />
performed to validate <strong>the</strong> suspected failure. Figure 6.1 shows CSAM image <strong>of</strong> <strong>the</strong><br />
suspected failure location. Figure 6.2 shows <strong>the</strong> SEM image <strong>of</strong> <strong>the</strong> bump after cross<br />
section.<br />
52