- Page 2 and 3:
Water and Solute Permeability of Pl
- Page 4 and 5:
Professor Dr. Lukas Schreiber Ecoph
- Page 6 and 7:
vi Preface This is not a review abo
- Page 8 and 9:
Contents 1 Chemistry and Structure
- Page 10 and 11:
Contents xi 4.6.3 Diffusion Coeffic
- Page 12 and 13:
Contents xiii 7.4.2 Effects of Plas
- Page 14 and 15:
2 1 Chemistry and Structure of Cuti
- Page 16 and 17:
4 1 Chemistry and Structure of Cuti
- Page 18 and 19:
6 1 Chemistry and Structure of Cuti
- Page 20 and 21:
8 1 Chemistry and Structure of Cuti
- Page 22 and 23:
10 1 Chemistry and Structure of Cut
- Page 24 and 25:
12 1 Chemistry and Structure of Cut
- Page 26 and 27:
14 1 Chemistry and Structure of Cut
- Page 28 and 29:
16 1 Chemistry and Structure of Cut
- Page 30 and 31:
18 1 Chemistry and Structure of Cut
- Page 32 and 33:
20 1 Chemistry and Structure of Cut
- Page 34 and 35:
22 1 Chemistry and Structure of Cut
- Page 36 and 37:
24 1 Chemistry and Structure of Cut
- Page 38 and 39:
26 1 Chemistry and Structure of Cut
- Page 40 and 41:
28 1 Chemistry and Structure of Cut
- Page 42 and 43:
Chapter 2 Quantitative Description
- Page 44 and 45:
2.1 Models for Analysing Mass Trans
- Page 46 and 47:
2.1 Models for Analysing Mass Trans
- Page 48 and 49:
2.1 Models for Analysing Mass Trans
- Page 50 and 51:
2.3 Steady State Diffusion Across a
- Page 52 and 53:
2.4 Steady State Diffusion of a Sol
- Page 54 and 55:
2.4 Steady State Diffusion of a Sol
- Page 56 and 57:
2.5 Diffusion Across a Membrane wit
- Page 58 and 59:
2.5 Diffusion Across a Membrane wit
- Page 60 and 61:
2.6 Determination of the Diffusion
- Page 62 and 63:
Solutions 51 2.7 Summary In this ch
- Page 64 and 65:
Chapter 3 Permeance, Diffusion and
- Page 66 and 67:
3.1 Units of Permeability 55 3.1.1
- Page 68 and 69:
3.1 Units of Permeability 57 identi
- Page 70 and 71:
3.3 Partition Coefficients 59 The d
- Page 72 and 73:
Chapter 4 Water Permeability All te
- Page 74 and 75:
4.1 Water Permeability of Synthetic
- Page 76 and 77:
4.2 Isoelectric Points of Polymer M
- Page 78 and 79:
4.2 Isoelectric Points of Polymer M
- Page 80 and 81:
4.3 Ion Exchange Capacity 69 The hi
- Page 82 and 83:
4.3 Ion Exchange Capacity 71 has an
- Page 84 and 85:
4.3 Ion Exchange Capacity 73 Counte
- Page 86 and 87:
4.4 Water Vapour Sorption and Perme
- Page 88 and 89:
4.4 Water Vapour Sorption and Perme
- Page 90 and 91:
4.5 Diffusion and Viscous Transport
- Page 92 and 93:
4.5 Diffusion and Viscous Transport
- Page 94 and 95:
4.5 Diffusion and Viscous Transport
- Page 96 and 97:
4.5 Diffusion and Viscous Transport
- Page 98 and 99:
4.5 Diffusion and Viscous Transport
- Page 100 and 101:
4.5 Diffusion and Viscous Transport
- Page 102 and 103:
4.5 Diffusion and Viscous Transport
- Page 104 and 105:
4.6 Water Permeability of Isolated
- Page 106 and 107:
4.6 Water Permeability of Isolated
- Page 108 and 109:
4.6 Water Permeability of Isolated
- Page 110 and 111:
4.6 Water Permeability of Isolated
- Page 112 and 113:
4.6 Water Permeability of Isolated
- Page 114 and 115:
4.6 Water Permeability of Isolated
- Page 116 and 117:
4.6 Water Permeability of Isolated
- Page 118 and 119:
4.6 Water Permeability of Isolated
- Page 120 and 121:
4.6 Water Permeability of Isolated
- Page 122 and 123:
4.6 Water Permeability of Isolated
- Page 124 and 125:
4.6 Water Permeability of Isolated
- Page 126 and 127:
4.6 Water Permeability of Isolated
- Page 128 and 129:
4.6 Water Permeability of Isolated
- Page 130 and 131:
4.8 Water Permeability of Isolated
- Page 132 and 133:
Problems 121 Our present knowledge
- Page 134 and 135:
Solutions 123 5. Ca 2+ , because se
- Page 136 and 137:
126 5 Penetration of Ionic Solutes
- Page 138 and 139:
128 5 Penetration of Ionic Solutes
- Page 140 and 141:
130 5 Penetration of Ionic Solutes
- Page 142 and 143:
132 5 Penetration of Ionic Solutes
- Page 144 and 145: 134 5 Penetration of Ionic Solutes
- Page 146 and 147: 136 5 Penetration of Ionic Solutes
- Page 148 and 149: 138 5 Penetration of Ionic Solutes
- Page 150 and 151: 140 5 Penetration of Ionic Solutes
- Page 152 and 153: 142 5 Penetration of Ionic Solutes
- Page 154 and 155: 144 5 Penetration of Ionic Solutes
- Page 156 and 157: 146 6 Diffusion of Non-Electrolytes
- Page 158 and 159: 148 6 Diffusion of Non-Electrolytes
- Page 160 and 161: 150 6 Diffusion of Non-Electrolytes
- Page 162 and 163: 152 6 Diffusion of Non-Electrolytes
- Page 164 and 165: 154 6 Diffusion of Non-Electrolytes
- Page 166 and 167: 156 6 Diffusion of Non-Electrolytes
- Page 168 and 169: 158 6 Diffusion of Non-Electrolytes
- Page 170 and 171: 160 6 Diffusion of Non-Electrolytes
- Page 172 and 173: 162 6 Diffusion of Non-Electrolytes
- Page 174 and 175: 164 6 Diffusion of Non-Electrolytes
- Page 176 and 177: 166 6 Diffusion of Non-Electrolytes
- Page 178 and 179: 168 6 Diffusion of Non-Electrolytes
- Page 180 and 181: 170 6 Diffusion of Non-Electrolytes
- Page 182 and 183: 172 6 Diffusion of Non-Electrolytes
- Page 184 and 185: 174 6 Diffusion of Non-Electrolytes
- Page 186 and 187: 176 6 Diffusion of Non-Electrolytes
- Page 188 and 189: 178 6 Diffusion of Non-Electrolytes
- Page 190 and 191: 180 6 Diffusion of Non-Electrolytes
- Page 192 and 193: 182 6 Diffusion of Non-Electrolytes
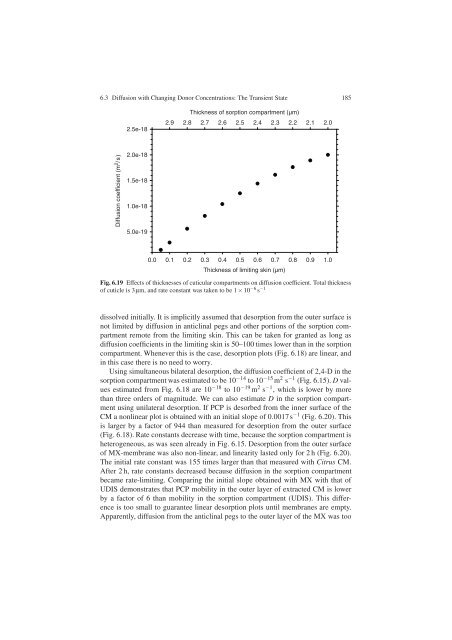
- Page 196 and 197: 186 6 Diffusion of Non-Electrolytes
- Page 198 and 199: 188 6 Diffusion of Non-Electrolytes
- Page 200 and 201: 190 6 Diffusion of Non-Electrolytes
- Page 202 and 203: 192 6 Diffusion of Non-Electrolytes
- Page 204 and 205: 194 6 Diffusion of Non-Electrolytes
- Page 206 and 207: 196 6 Diffusion of Non-Electrolytes
- Page 208 and 209: 198 6 Diffusion of Non-Electrolytes
- Page 210 and 211: 200 6 Diffusion of Non-Electrolytes
- Page 212 and 213: 202 6 Diffusion of Non-Electrolytes
- Page 214 and 215: 204 6 Diffusion of Non-Electrolytes
- Page 216 and 217: 206 7 Accelerators Increase Solute
- Page 218 and 219: 208 7 Accelerators Increase Solute
- Page 220 and 221: 210 7 Accelerators Increase Solute
- Page 222 and 223: 212 7 Accelerators Increase Solute
- Page 224 and 225: 214 7 Accelerators Increase Solute
- Page 226 and 227: 216 7 Accelerators Increase Solute
- Page 228 and 229: 218 7 Accelerators Increase Solute
- Page 230 and 231: 220 7 Accelerators Increase Solute
- Page 232 and 233: 222 7 Accelerators Increase Solute
- Page 234 and 235: 224 7 Accelerators Increase Solute
- Page 236 and 237: 226 7 Accelerators Increase Solute
- Page 238 and 239: 228 7 Accelerators Increase Solute
- Page 240 and 241: 230 7 Accelerators Increase Solute
- Page 242 and 243: Chapter 8 Effects of Temperature on
- Page 244 and 245:
8.1 Sorption from Aqueous Solutions
- Page 246 and 247:
8.1 Sorption from Aqueous Solutions
- Page 248 and 249:
8.2 Solute Mobility in Cuticles 239
- Page 250 and 251:
8.2 Solute Mobility in Cuticles 241
- Page 252 and 253:
8.2 Solute Mobility in Cuticles 243
- Page 254 and 255:
8.2 Solute Mobility in Cuticles 245
- Page 256 and 257:
8.3 Water Permeability in CM and MX
- Page 258 and 259:
8.3 Water Permeability in CM and MX
- Page 260 and 261:
8.4 Thermal Expansion of CM, MX, Cu
- Page 262 and 263:
8.5 Water Permeability of Synthetic
- Page 264 and 265:
8.5 Water Permeability of Synthetic
- Page 266 and 267:
Problems 257 E D (kJ/mol) DH S (kJ/
- Page 268 and 269:
Chapter 9 General Methods, Sources
- Page 270 and 271:
9.2 Testing Integrity of Isolated C
- Page 272 and 273:
9.4 Distribution of Water and Solut
- Page 274 and 275:
9.6 Cutin and Wax Analysis and Prep
- Page 276 and 277:
9.7 Measuring Water Permeability 26
- Page 278 and 279:
9.8 Measuring Solute Permeability 2
- Page 280 and 281:
9.8 Measuring Solute Permeability 2
- Page 282 and 283:
9.8 Measuring Solute Permeability 2
- Page 284 and 285:
276 Appendix A Abbreviations (conti
- Page 286 and 287:
278 Appendix A Symbols (continued)
- Page 288 and 289:
280 Appendix B Physico-chemical pro
- Page 290 and 291:
Appendix C Index of Plants Botanica
- Page 292 and 293:
References Abraham MH, McGowan JC (
- Page 294 and 295:
References 287 Doty PM, Aiken WH, M
- Page 296 and 297:
References 289 Kolattukudy P (2004)
- Page 298 and 299:
References 291 Sabljic A, Güsten H
- Page 300 and 301:
References 293 Schreiber L, Schönh
- Page 302 and 303:
Index 2,4-D, 46 2,4-Dichlorophenoxy
- Page 304 and 305:
Index 297 leaf disks, 130 leaf surf
- Page 306:
Index 299 water molar volume, 110 p