Water and Solute Permeability of Plant Cuticles: Measurement and ...
Water and Solute Permeability of Plant Cuticles: Measurement and ...
Water and Solute Permeability of Plant Cuticles: Measurement and ...

Create successful ePaper yourself
Turn your PDF publications into a flip-book with our unique Google optimized e-Paper software.
212 7 Accelerators Increase <strong>Solute</strong> <strong>Permeability</strong> <strong>of</strong> <strong>Cuticles</strong><br />
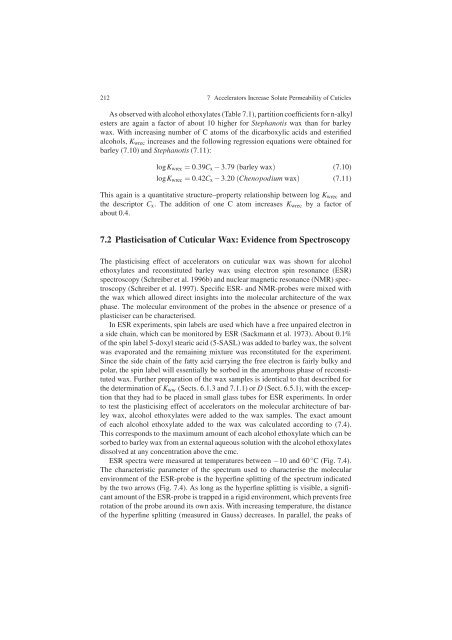
As observed with alcohol ethoxylates (Table 7.1), partition coefficients for n-alkyl<br />
esters are again a factor <strong>of</strong> about 10 higher for Stephanotis wax than for barley<br />
wax. With increasing number <strong>of</strong> C atoms <strong>of</strong> the dicarboxylic acids <strong>and</strong> esterified<br />
alcohols, Kwrec increases <strong>and</strong> the following regression equations were obtained for<br />
barley (7.10) <strong>and</strong> Stephanotis (7.11):<br />
logKwrec = 0.39Cx − 3.79 (barley wax) (7.10)<br />
logKwrec = 0.42Cx − 3.20 (Chenopodium wax) (7.11)<br />
This again is a quantitative structure–property relationship between log Kwrec <strong>and</strong><br />
the descriptor Cx. The addition <strong>of</strong> one C atom increases Kwrec by a factor <strong>of</strong><br />
about 0.4.<br />
7.2 Plasticisation <strong>of</strong> Cuticular Wax: Evidence from Spectroscopy<br />
The plasticising effect <strong>of</strong> accelerators on cuticular wax was shown for alcohol<br />
ethoxylates <strong>and</strong> reconstituted barley wax using electron spin resonance (ESR)<br />
spectroscopy (Schreiber et al. 1996b) <strong>and</strong> nuclear magnetic resonance (NMR) spectroscopy<br />
(Schreiber et al. 1997). Specific ESR- <strong>and</strong> NMR-probes were mixed with<br />
the wax which allowed direct insights into the molecular architecture <strong>of</strong> the wax<br />
phase. The molecular environment <strong>of</strong> the probes in the absence or presence <strong>of</strong> a<br />
plasticiser can be characterised.<br />
In ESR experiments, spin labels are used which have a free unpaired electron in<br />
a side chain, which can be monitored by ESR (Sackmann et al. 1973). About 0.1%<br />
<strong>of</strong> the spin label 5-doxyl stearic acid (5-SASL) was added to barley wax, the solvent<br />
was evaporated <strong>and</strong> the remaining mixture was reconstituted for the experiment.<br />
Since the side chain <strong>of</strong> the fatty acid carrying the free electron is fairly bulky <strong>and</strong><br />
polar, the spin label will essentially be sorbed in the amorphous phase <strong>of</strong> reconstituted<br />
wax. Further preparation <strong>of</strong> the wax samples is identical to that described for<br />
the determination <strong>of</strong> Kww (Sects. 6.1.3 <strong>and</strong> 7.1.1) or D (Sect. 6.5.1), with the exception<br />
that they had to be placed in small glass tubes for ESR experiments. In order<br />
to test the plasticising effect <strong>of</strong> accelerators on the molecular architecture <strong>of</strong> barley<br />
wax, alcohol ethoxylates were added to the wax samples. The exact amount<br />
<strong>of</strong> each alcohol ethoxylate added to the wax was calculated according to (7.4).<br />
This corresponds to the maximum amount <strong>of</strong> each alcohol ethoxylate which can be<br />
sorbed to barley wax from an external aqueous solution with the alcohol ethoxylates<br />
dissolved at any concentration above the cmc.<br />
ESR spectra were measured at temperatures between −10 <strong>and</strong> 60 ◦ C (Fig. 7.4).<br />
The characteristic parameter <strong>of</strong> the spectrum used to characterise the molecular<br />
environment <strong>of</strong> the ESR-probe is the hyperfine splitting <strong>of</strong> the spectrum indicated<br />
by the two arrows (Fig. 7.4). As long as the hyperfine splitting is visible, a significant<br />
amount <strong>of</strong> the ESR-probe is trapped in a rigid environment, which prevents free<br />
rotation <strong>of</strong> the probe around its own axis. With increasing temperature, the distance<br />
<strong>of</strong> the hyperfine splitting (measured in Gauss) decreases. In parallel, the peaks <strong>of</strong>