Water and Solute Permeability of Plant Cuticles: Measurement and ...
Water and Solute Permeability of Plant Cuticles: Measurement and ...
Water and Solute Permeability of Plant Cuticles: Measurement and ...

Create successful ePaper yourself
Turn your PDF publications into a flip-book with our unique Google optimized e-Paper software.
8.2 <strong>Solute</strong> Mobility in <strong>Cuticles</strong> 241<br />
This shows that Do is proportional to the square <strong>of</strong> the jump distances, temperature<br />
<strong>and</strong> <strong>of</strong> some physical constants. The entropy enters as an exponent.<br />
Temperature dependence <strong>of</strong> diffusion is usually described using (8.6). D is measured<br />
at various temperatures, <strong>and</strong> ln D is plotted versus T −1 . If the slope is a<br />
straight line ED can be calculated from the slope, <strong>and</strong> the y-intercept is equivalent<br />
to ln Do. With Do <strong>and</strong> activation energy known, D can be calculated for any other<br />
temperature (8.6).<br />
These equations can be used to investigate dependence on temperature <strong>of</strong> solute<br />
mobility in CM <strong>and</strong> MX. Using the UDOS method (Sect. 6.3), rate constants k ∗<br />
are obtained which are proportional to diffusion coefficients. In CM, their magnitude<br />
depends on properties <strong>of</strong> the waxy barrier. Temperatures studied, ranged from<br />
15 to 70 ◦ C, <strong>and</strong> internal solute concentrations were in the order <strong>of</strong> mg kg −1 . At<br />
these concentrations, solute–membrane interactions predominate <strong>and</strong> solute–solute<br />
interactions in cuticles are improbable.<br />
8.2.1 Effect <strong>of</strong> Temperature on Rate Constants k ∗<br />
Rate constants were measured at various temperatures, <strong>and</strong> k ∗ was calculated using<br />
(6.3). Temperature dependence was analysed based on the Arrhenius equation:<br />
k ∗ = k ∗ infinite exp(−ED/RT) (8.12)<br />
where k ∗ infinite is the pre-exponential factor <strong>and</strong> ED is the activation energy <strong>of</strong> diffusion.<br />
This equation is similar to (8.6), except that D was replaced by the UDOS<br />
rate constant k ∗ . In the original publications by Baur et al. (1997a), Buchholz <strong>and</strong><br />
Schönherr (2000) <strong>and</strong> Buchholz 2006, the symbol for pre-exponential factor was k ∗ o<br />
similarly as for Do in (8.6). However, k ∗ o was previously used for rate constants for<br />
solutes having zero molar volume (Buchholz et al. 1998, Sects. 6.3.2.2 <strong>and</strong> 6.3.2.3);<br />
we now define the symbol k ∗ infinite for the y-intercept <strong>of</strong> Arrhenius plots. This<br />
y-intercept k ∗ infinite is the solute mobility at infinite temperature. By plotting log k∗<br />
vs the reciprocal <strong>of</strong> the Kelvin temperature, a straight line is obtained <strong>and</strong> ED can<br />
be calculated from the slope:<br />
ED = −2.3 × slope× R (8.13)<br />
The factor 2.3 is included in the above equation because published Arrhenius plots<br />
are on log scale, rather than ln scale as in (8.6) <strong>and</strong> (8.12).<br />
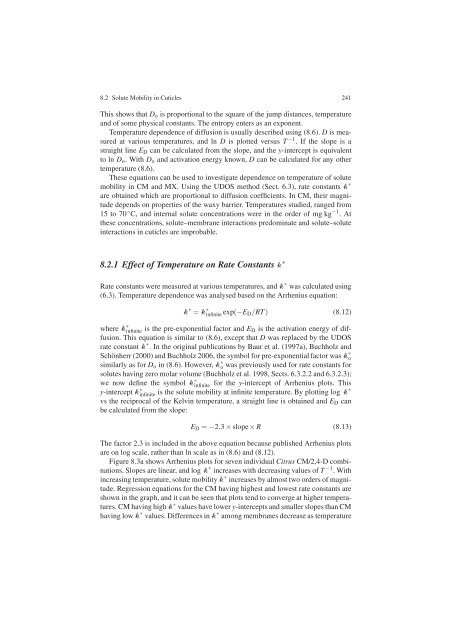
Figure 8.3a shows Arrhenius plots for seven individual Citrus CM/2,4-D combinations.<br />
Slopes are linear, <strong>and</strong> log k ∗ increases with decreasing values <strong>of</strong> T −1 . With<br />
increasing temperature, solute mobility k ∗ increases by almost two orders <strong>of</strong> magnitude.<br />
Regression equations for the CM having highest <strong>and</strong> lowest rate constants are<br />
shown in the graph, <strong>and</strong> it can be seen that plots tend to converge at higher temperatures.<br />
CM having high k ∗ values have lower y-intercepts <strong>and</strong> smaller slopes than CM<br />
having low k ∗ values. Differences in k ∗ among membranes decrease as temperature