Table 3-Continued Region, Country, and Income Group SIiddle-incoie countries Argentina larbildos Belize Brazil Chile Colombia Costa Rica Cuba Dominica Dominican Republic Ecuador El Salvador Grenada Gutatemala 1llogiditras Jamaica Martinique Mexico Nicaragua Panama Paraguay Peru Surinam Trinidad and Tobago Turks and Caicos Uruguay Vnezuela Average 30 Percent of Density of Field-Level RFls Not Vertically RFIsb Organized' Year Density (1) (2) (3) 33 nMa. n.a. 0 na. n.a. 25 n.a. n.a. 0 na. .a. 0 na. ni. 0 na. na. 0 na. na. 0 na. na. 25 nMa. n.a. 25 a. na. 0 na. na. 0 na. na. 33 n.a. n.a. 25 a. na. 0 na. n a. 0 na. ia. 33 a a 25 ita. na. 20 na. .a. 33 na. na. 25 nia. n.a. 20 na. na. 0 na. na. 25 na. na. 67 na. na. 33 na. na. 0 na. i.a. I.I na. na. Proportion of Rural People Borrowing from RFIs Year Percent (4) (5) n.a. nMa. i1.a. n.a. na. n.a. 1975 15.0 1975 28.0 1975 38.0 n.a. n1a. n.a. n.a. nMa. i.ta. 1975 1,1.0 1975 18.0 1975 9.0 n.a. n.a. 1975 2.0 1975 10.0 1975 65.0 .ak. 1na. 1975 20.0 1975 20.0 1975 20.0 1975 1.0 1975 21.0 n.a. n.a. 1975 10.0 na. n.a. na. na. i1 .a. La. 1975 22.6 1985; Donald 1976; FAO 1973, 1974la, Sources: Asian Productivity Organization 198-1, 19711), 1975, 1976; Kato 1966, 198.1; Olin 1975; Rangaratjan 1971; Reserve Bank of India v%,rios issues a. variotts issues b; and \%,idayati 1985. Note: I.a. itteans tnot available. those [hat have regional, national, and local-level institu 'Vertically organized RFIs ate tions. 1Density of field-level RlIs is ncasutred as the nut titber of these institutions per 1,000 hectares of arable land. 'The Peoples' Republic of China is excluded.
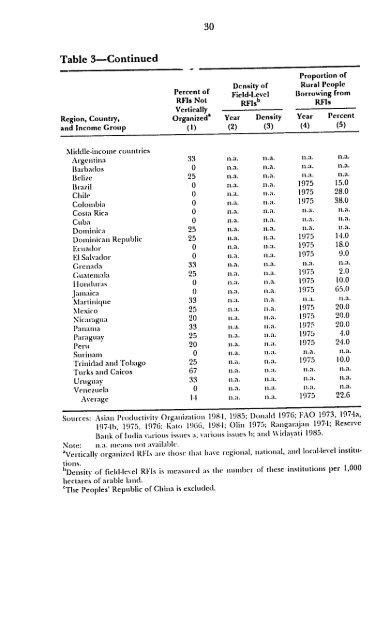
31 LICs (including Bangladesh, India, Indonesia, Nepal, and Sri Lanka). The correlation between income and density of RFIs is bornc out when Asian MICs and LICs are compared (Taiwan and the Republic of Korea as against the Philippines and Thailand, for example; o Chiia, India, Nepal, and S-i Ianka as against Bangladesh and Indonesia). Two additional observations may be made. First, the countries of North America and Western Europe are likely to have a higher density of field-level RFIs thanjapan. And second, many countries in Africa, the Near East and Mediterranean Basin, and Latin America and the Caribbean have very low densities; the proportion of farmers covered by RF in these regions is lower than in Asia. Proportion of Rural Households Reached by an RFI System Tile importance of covering a high proportion of rural households cannot be questioned. Agricultural ciedlit policy also iiins at larger coverage of rural households not only to meet their credit needs, bIit also to provide a place to deposit excess liquidity whenever it arises during production and consumption cycles. The following findings are derived fion cohrinii 5 ini T;dle 3. First, the share of rural people borrowing from RFIs is higlher in MICs than in lICs, no matter in w lticlhl dvelopilig-coilnry region the cotlry is located. Second, for tile region as a whole, lie share of' bolrowers is highest in Asia (23.55), followed by li.atin America and tile Caribbean (20.,47), the Near East and Mediterranean Basin (9.10), and Suil-Salia'ai Africa (6.11). Third, this ordering of tile four regions remains tilichanged when countries wid 'cry high perccitages are excluded; Asia (13.78 percent), followed by Latin America and the Caribbean (13.07), then the Near Eas: and Mediterraneai Basin (9.,40), and lastly Africa (6. 11). And fourth, two recently developed Asian MICs, Taiwan and the Republic of Korea, have RFI systems reaching the largest pIoportiol of rural households.9 Another policy concern is the i)Loportio,, of small farmuiers reachned by RFIs. Available data on 17 countries suggest 'hat Ihe share of small farmers reached is highest in Asian MICs (pai,icilarly Taiwai), followed 81n Sone cases, tlie association I)ciwecll agricrrlil lg. 'ls l ol " I)(l (ia)ila tea;t national income and density of RFIs among Asian tICs is not app;,enl., Suggesting ihat other factors also influence density. These include va'ied agroclinralic environlnent, terain1 of the countrN,, and size of the rural population. Consequenrtly, strong positive assuJclitio may not result, particularly in the short- to medium-term period. 9 "this share is, however, lower in the Republic of Korea than inJanmaica or Pcr m. This may be because the ,ear to which dala refcr man have extra rdinarily low alrid high figures. Moreover, the Korean RFI system is widely acclainied as successfu, but tlre Jamaican and Peruvian systems are not (Adams 1988h; Asiani P'roduchiviv Olgainization 198.1; Brake 1971; Donald 1976; FAO 1 9 74a, 1975; Kato 198.1; D. I. Lee 198.1; and Olin 1975).
- Page 1 and 2: ,AFOOD POLICY EVIEWl Institutional
- Page 3 and 4: FOOD POLICY REVIEW 1 Institutional
- Page 5 and 6: Chapter One Chapter Two Chapter Thr
- Page 7 and 8: 15. Unit transaction costs, unit ir
- Page 9 and 10: 47. Relative importance of intcecst
- Page 11 and 12: Foreword Thiis report introduces a
- Page 13 and 14: 1 Summary This study analyzes two a
- Page 15 and 16: 3 Six organizational principles for
- Page 17 and 18: 2 Introduction Finance and Economic
- Page 19 and 20: An obvious problem innate to an act
- Page 21 and 22: 9 Selection of Theme and Issues for
- Page 23 and 24: I1 TIhe issue of scale economies is
- Page 25 and 26: 13 There is also a problem of indiv
- Page 27 and 28: 15 Figure I-Share of borrowing of f
- Page 29 and 30: 17 Figure 2-Share of'agricultural l
- Page 31 and 32: 19 specific or economywile developm
- Page 33 and 34: Table 1- Continued 21 Region, Count
- Page 35 and 36: Table 2-Continued Government Nation
- Page 37 and 38: 25 regional without higher or lower
- Page 39 and 40: 27 Caribbean, compared with Asia. T
- Page 41: Table 3 -Continued Proportion of Pe
- Page 45 and 46: 33 Functional Structure of RFIs and
- Page 47 and 48: 35 approximated from available lite
- Page 49 and 50: Figure 3-Stylized organizational fr
- Page 51 and 52: 5 Transaction Costs, Profitability,
- Page 53 and 54: 411 or fiom new borrowers. Moreover
- Page 55 and 56: 43 Table 6-Unit transaction costs o
- Page 57 and 58: 45 tiotis largely by borrowing fi'o
- Page 59 and 60: 47 Table 9 -Transaction costs of br
- Page 61 and 62: 49 'T7heSonali Bank's unit uct marg
- Page 63 and 64: Table 14-Estimated parameters of th
- Page 65 and 66: 53 PACS) was established ill March
- Page 67 and 68: 55 Table 16-Deposit growth rates of
- Page 69 and 70: 57 rIIIIal Output (28 p)Celt) and o
- Page 71 and 72: 59 Although APS loans were dominant
- Page 73 and 74: Table 2 0-Pattern of loans advanced
- Page 75 and 76: 63 Table 2 1- Unit profit and unit
- Page 77 and 78: 65 resources are mainly channeled t
- Page 79 and 80: 67 Table 25-Various costs, gross ma
- Page 81 and 82: 69 BAAC also en1joyced sc.;le ,~ol
- Page 83 and 84: 71 iuzividual farmers at the distri
- Page 85 and 86: 73 Agriculture and Cooperatives 197
- Page 87 and 88: 75 like the county and plimaly coop
- Page 89 and 90: 77 Table 33-Transaction and financi
- Page 91 and 92: 79 Table 3 6 -Structure of assets a
- Page 93 and 94:
Response of Rural Loan Demand to In
- Page 95 and 96:
83 Table 3 9-Estimated multivariate
- Page 97 and 98:
85 Table 40-Estimated multivariate
- Page 99 and 100:
87 separate deteriminants of demand
- Page 101 and 102:
Table 4 1-Continued Type of Demand,
- Page 103 and 104:
Table 4 1-Confinued Type of Demand,
- Page 105 and 106:
Table 4 2 -Evidence on interest ela
- Page 107 and 108:
7 Response of Supply of Rural Depos
- Page 109 and 110:
97 Table 44-Estimated multivariate
- Page 111 and 112:
99 Table 4 6-Relative importance of
- Page 113 and 114:
101 I1e positivc respolse of supply
- Page 115 and 116:
Table 48- Continued 103 eBased on t
- Page 117 and 118:
Table 4 9 -Pattern of total rural s
- Page 119 and 120:
107 is substantial saving even in d
- Page 121 and 122:
109 Table 52-Estimated multivariate
- Page 123 and 124:
111 nient), and lastly, the inverse
- Page 125 and 126:
113 Table 54-Positive and negative
- Page 127 and 128:
9 Flow of Funds of the Rural Financ
- Page 129 and 130:
117 interest I'evellie and payment.
- Page 131 and 132:
Table 5 5 -Continued 119 cin scenar
- Page 133 and 134:
10 Conclusions and Implications ase
- Page 135 and 136:
123 differential increase in demand
- Page 137 and 138:
125 can be attained. Multifunctiona
- Page 139 and 140:
127 fully achieved. Had the institu
- Page 141 and 142:
129 so doing, improvements in verti
- Page 143 and 144:
The standard error of The standard
- Page 145 and 146:
Appendix 2 Reasons for Delinquency
- Page 147 and 148:
Region/Country 135 Reaso.z Near Eas
- Page 149 and 150:
References Abbott, J. C. 1 9 7 3a.
- Page 151 and 152:
139 Aku, P. S. 1986. Lending to far
- Page 153 and 154:
141 Caibbean Country Department II,
- Page 155 and 156:
143 144. Princeton, N.J., U.S.A.: W
- Page 157 and 158:
145 1975. Agriculturalcredit in Asi
- Page 159 and 160:
__ 147 Gurley, J. G., and E. S. Sha
- Page 161 and 162:
149 G. Hunter and A. F. Bottrall, 5
- Page 163 and 164:
151 Lee, T. Y., D. H. Kim, and D. W
- Page 165 and 166:
153 __ _. 1976. The new economics o
- Page 167 and 168:
155 Olu, W. 1985. Formal credit and
- Page 169 and 170:
__ 157 Rao, B. P. 1970. The economi
- Page 171 and 172:
159 Singh, G., and S. R. Asokan. 19
- Page 173 and 174:
-- 161 Verghese, S. K. 1983. tivfit