Migration Profile on Nigeria - IOM Publications - International ...
Migration Profile on Nigeria - IOM Publications - International ...
Migration Profile on Nigeria - IOM Publications - International ...

You also want an ePaper? Increase the reach of your titles
YUMPU automatically turns print PDFs into web optimized ePapers that Google loves.
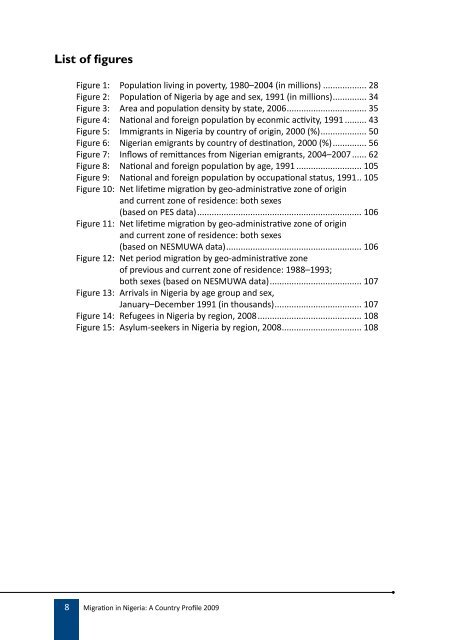
list of figures<br />
Figure 1: Populati<strong>on</strong> living in poverty, 1980–2004 (in milli<strong>on</strong>s) .................. 28<br />
Figure 2: Populati<strong>on</strong> of <strong>Nigeria</strong> by age and sex, 1991 (in milli<strong>on</strong>s) .............. 34<br />
Figure 3: Area and populati<strong>on</strong> density by state, 2006 ................................. 35<br />
Figure 4: Nati<strong>on</strong>al and foreign populati<strong>on</strong> by ec<strong>on</strong>mic activity, 1991 ......... 43<br />
Figure 5: Immigrants in <strong>Nigeria</strong> by country of origin, 2000 (%) ................... 50<br />
Figure 6: <strong>Nigeria</strong>n emigrants by country of destinati<strong>on</strong>, 2000 (%) .............. 56<br />
Figure 7: Inflows of remittances from <strong>Nigeria</strong>n emigrants, 2004–2007 ...... 62<br />
Figure 8: Nati<strong>on</strong>al and foreign populati<strong>on</strong> by age, 1991 ........................... 105<br />
Figure 9: Nati<strong>on</strong>al and foreign populati<strong>on</strong> by occupati<strong>on</strong>al status, 1991 .. 105<br />
Figure 10: Net lifetime migrati<strong>on</strong> by geo-administrative z<strong>on</strong>e of origin<br />
and current z<strong>on</strong>e of residence: both sexes<br />
(based <strong>on</strong> PES data) .................................................................... 106<br />
Figure 11: Net lifetime migrati<strong>on</strong> by geo-administrative z<strong>on</strong>e of origin<br />
and current z<strong>on</strong>e of residence: both sexes<br />
(based <strong>on</strong> NESMUWA data) ........................................................ 106<br />
Figure 12: Net period migrati<strong>on</strong> by geo-administrative z<strong>on</strong>e<br />
of previous and current z<strong>on</strong>e of residence: 1988–1993;<br />
both sexes (based <strong>on</strong> NESMUWA data) ...................................... 107<br />
Figure 13: Arrivals in <strong>Nigeria</strong> by age group and sex,<br />
January–December 1991 (in thousands) .................................... 107<br />
Figure 14: Refugees in <strong>Nigeria</strong> by regi<strong>on</strong>, 2008 ........................................... 108<br />
Figure 15: Asylum-seekers in <strong>Nigeria</strong> by regi<strong>on</strong>, 2008 ................................. 108<br />
8 <str<strong>on</strong>g>Migrati<strong>on</strong></str<strong>on</strong>g> in <strong>Nigeria</strong>: A Country <str<strong>on</strong>g>Profile</str<strong>on</strong>g> 2009