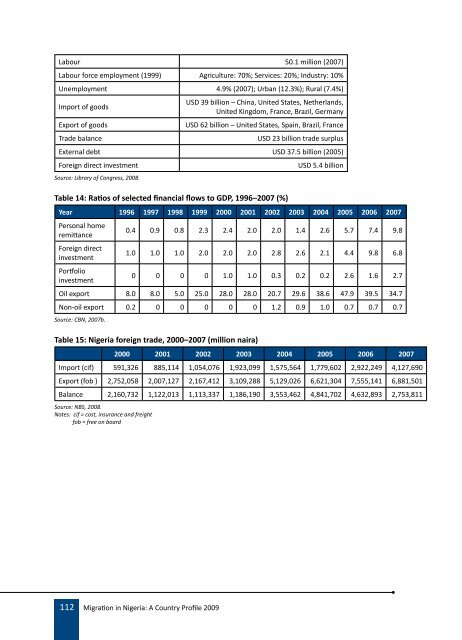
Labour 50.1 milli<strong>on</strong> (2007) Labour force employment (1999) Agriculture: 70%; Services: 20%; Industry: 10% Unemployment 4.9% (2007); Urban (12.3%); Rural (7.4%) Import of goods 112 <str<strong>on</strong>g>Migrati<strong>on</strong></str<strong>on</strong>g> in <strong>Nigeria</strong>: A Country <str<strong>on</strong>g>Profile</str<strong>on</strong>g> 2009 USD 39 billi<strong>on</strong> – China, United States, Netherlands, United Kingdom, France, Brazil, Germany Export of goods USD 62 billi<strong>on</strong> – United States, Spain, Brazil, France Trade balance USD 23 billi<strong>on</strong> trade surplus External debt USD 37.5 billi<strong>on</strong> (2005) Foreign direct investment USD 5.4 billi<strong>on</strong> Source: Library of C<strong>on</strong>gress, 2008. Table 14: Ratios of selected financial flows to GDP, 1996–2007 (%) Year 1996 1997 1998 1999 2000 2001 2002 2003 2004 2005 2006 2007 Pers<strong>on</strong>al home remittance 0.4 0.9 0.8 2.3 2.4 2.0 2.0 1.4 2.6 5.7 7.4 9.8 Foreign direct investment 1.0 1.0 1.0 2.0 2.0 2.0 2.8 2.6 2.1 4.4 9.8 6.8 Portfolio investment 0 0 0 0 1.0 1.0 0.3 0.2 0.2 2.6 1.6 2.7 Oil export 8.0 8.0 5.0 25.0 28.0 28.0 20.7 29.6 38.6 47.9 39.5 34.7 N<strong>on</strong>-oil export 0.2 0 0 0 0 0 1.2 0.9 1.0 0.7 0.7 0.7 Source: CBN, 2007b. Table 15: <strong>Nigeria</strong> foreign trade, 2000–2007 (milli<strong>on</strong> naira) 2000 2001 2002 2003 2004 2005 2006 2007 Import (cif) 591,326 885,114 1,054,076 1,923,099 1,575,564 1,779,602 2,922,249 4,127,690 Export (fob ) 2,752,058 2,007,127 2,167,412 3,109,288 5,129,026 6,621,304 7,555,141 6,881,501 Balance 2,160,732 1,122,013 1,113,337 1,186,190 3,553,462 4,841,702 4,632,893 2,753,811 Source: NBS, 2008. Notes: cif = cost, insurance and freight fob = free <strong>on</strong> board
Table 16: Graduate output: bachelor’s degree, postgraduate diploma, master’s degree and doctorate degree, 2002–2005 2002/2003 2003/2004 2004/2005 Discipline Male Female Male Female Male Female Administrati<strong>on</strong> 12,670 6,843 7,777 5,116 5,315 3,215 Agriculture 1,939 1,073 1,882 987 690 284 Arts 4,433 4,310 3,538 3,154 2,104 1,725 Educati<strong>on</strong> 5,313 4,713 3,958 4,405 3,031 2,634 Energy/Technology 6,199 1,028 4,989 819 1,824 188 Envir<strong>on</strong>mental science 1,488 699 1,335 487 1,105 397 Law 3,099 2,797 2,233 1,644 1,043 638 Medicine 1,821 1,074 1,776 868 448 284 Pharmacy 245 172 433 277 25 17 Science 6,715 4,593 5,375 2,978 5,092 1,610 Social science 10,693 6,662 8,853 5,269 4,170 3,113 Dentistry 67 30 57 22 2 0 Veterinary medicine 190 64 86 32 48 13 Others 1,152 497 681 269 280 211 Total 56,024 34,555 42,973 29,327 25,177 14,329 Grand total 90,579 69,300 39,506 Source: NUC, 2005. Table 17: Primary school, sec<strong>on</strong>dary school and university statistics, 2001–2005 2001 2002 2003 2004 2005 Primary school Total number of schools 49,306 51,870 59,174 50,741 50,741 Total enrolment 19,263,534 19,861,681 25,772,044 20,037,480 20,951,818 Total number of teachers 487,303 491,751 591,041 599,212 594,192 Teacher/pupil ratio Sec<strong>on</strong>dary school 40 40 44 33 35 Total number of schools 6,319 6,305 9,221 10,913 11,010 Total enrolment 5,528,384 6,292,164 7,171,304 5,388,734 5,422,611 Total number of teachers 143,315 163,348 180,278 154,021 156,635 Teacher/pupil ratio University 38 39 40 35 35 Total number of instituti<strong>on</strong>s 51 57 59 63 80 Total enrolment 358,758 444,949 606,104 727,408 724,856 Total number of teachers 18,867 18,426 22,046 23,871 23,535 Teacher/pupil ratio Source: UBEC, 2005. 19 24 27 30 31 <str<strong>on</strong>g>Migrati<strong>on</strong></str<strong>on</strong>g> in <strong>Nigeria</strong>: A Country <str<strong>on</strong>g>Profile</str<strong>on</strong>g> 2009 113
- Page 1 and 2:
This publication has been co-financ
- Page 3:
This publication has been co-financ
- Page 7 and 8:
conTenTs List of tables ...........
- Page 9 and 10:
list of tables Table 1: Trends in p
- Page 11 and 12:
acronyms AVR Assisted voluntary ret
- Page 13 and 14:
Foreword Over the past three years,
- Page 15:
NIGERIA - Basic facts Population (2
- Page 18 and 19:
Estimates made by the Development R
- Page 20 and 21:
Part of the problem is the lack of
- Page 23 and 24:
ésumé L’immigration au Nigéria
- Page 25 and 26:
2007. Cet accroissement a eu lieu m
- Page 27 and 28:
En outre, ce projet de politique pr
- Page 29 and 30:
parT a: introduction Part A of the
- Page 31 and 32:
Nigerians that is likely to be a
- Page 33:
the gender difference was slight, b
- Page 36 and 37:
Figure 2: Population of Nigeria by
- Page 38 and 39:
the two census years, 1991 and 2006
- Page 40 and 41:
this report had been carried out be
- Page 42 and 43:
infrastructure, food security and a
- Page 44 and 45:
address existing problems that are
- Page 46 and 47:
school level has also been increasi
- Page 49 and 50:
parT c: analysis of the migration s
- Page 51 and 52:
2000 and 2005 Nigeria recorded a 5.
- Page 53 and 54:
However, Table 7 indicates fluctuat
- Page 55 and 56:
Students No recent data on students
- Page 57 and 58:
pilgrimage, sexual exploitation, do
- Page 59 and 60:
Despite this, Table 7 and Table 25
- Page 61 and 62:
Students From 2000 to 2006, the num
- Page 63 and 64: Trafficking and smuggling in person
- Page 65 and 66: 2007 (CBN, 2007b), as shown in Tabl
- Page 67 and 68: parT D: Factors driving migration D
- Page 69: It is often less the lack of employ
- Page 72 and 73: with a view to its finalization. Su
- Page 74 and 75: of the Federal Republic of Nigeria
- Page 76 and 77: persons in Nigeria and, in 2009, un
- Page 78 and 79: - drafting of bills and other legal
- Page 80 and 81: - to strengthen and enhance effecti
- Page 82 and 83: Despite the lack of an official coo
- Page 84 and 85: The strategic approach used is desi
- Page 86 and 87: Bilateral agreements The following
- Page 88 and 89: created, they lack the appropriate
- Page 91 and 92: parT F: evaluating the consequences
- Page 93 and 94: parT g: conclusions g.1 main findin
- Page 95 and 96: improved in order to promote a more
- Page 97 and 98: (ECCAS) (for example, the 2001 ECOW
- Page 99 and 100: eferences Aboderin, I. 2007 Context
- Page 101 and 102: Docquier, F. and A. Bhargava 2006 M
- Page 103 and 104: National Agency for the Prohibition
- Page 105 and 106: Universal Basic Education Commissio
- Page 107 and 108: annex: statistics Figure 8: Nationa
- Page 109 and 110: Figure 12: Net period migration by
- Page 111 and 112: Table 9: Tuberculosis prevalence ra
- Page 113: Table 12: Population and migration
- Page 117 and 118: Table 19: Refugees in Nigeria by na
- Page 119 and 120: Table 21: Distribution of employed
- Page 121 and 122: Russian Federation 2 0 2 South Afri
- Page 123: Table 29: Remittance inflows and an