Table 26: Outflow of asylum-seekers from <strong>Nigeria</strong> by nati<strong>on</strong>ality, 2000–2008 Country 2000 2001 2002 2003 2004 2005 2006 2007 2008 Austria 390 1,047 1,432 1,849 1,828 880 421 394 535 Canada 800 790 828 637 589 591 685 760 765 France 463 571 884 1,252 1,572 976 434 446 462 Germany 420 526 987 1,051 1,130 608 481 503 561 Greece 14 33 184 444 325 406 391 390 746 Ireland 3,405 3,461 4,050 3,110 1,776 1,278 1,038 1,028 1,009 Italy 57 388 594 722 930 536 0 1,336 5,673 South Africa 114 223 3,244 4,550 1,058 775 712 904 16 Spain 843 1,350 1,440 1,688 1,029 726 632 680 808 Switzerland 226 289 1,062 480 418 219 209 310 988 United Kingdom 835 870 1,125 1,110 1,210 1,230 940 905 970 United States 58 50 73 99 82 59 162 165 177 Others 1,207 1,638 2,249 2,415 2,326 2,180 2,189 2,327 2,312 Total 8,832 11,236 18,152 19,407 14,273 10,464 8,294 10,148 15,022 Source: UNHCR, 2009. Table 27: Outbound tourism by regi<strong>on</strong> and destinati<strong>on</strong>, 2003–2006 120 <str<strong>on</strong>g>Migrati<strong>on</strong></str<strong>on</strong>g> in <strong>Nigeria</strong>: A Country <str<strong>on</strong>g>Profile</str<strong>on</strong>g> 2009 2003 2004 2005 2006 2007 Africa 149,601 168,629 166,111 98,298 86,663 America 52,180 51,278 55,027 53,936 61,969 Europe 106,579 146,565 146,773 152,099 159,384 East Asia and the Pacific 22,536 20,585 25,364 31,139 2,292 South Asia 111,022 132,101 112,515 110,558 33,795 Middle East 14,264 19,444 12,481 26,202 33,149 Total 456,182 538,602 518,271 472,232 377,252 Source: UNWTO, 2008. Table 28: Worker remittance flows from and to <strong>Nigeria</strong>, 2000–2009 (in milli<strong>on</strong>s) 2000 2001 2002 2003 2004 2005 2006 2007 2008 2009 Inward remittance flows 1,392 1,167 1,209 1,063 2,273 3,329 5,435 9,221 9,980 9,585 % of GDP – – – – – 3.4 2.8 6.7 4.7 – Outward remittance flows 1 1 1 12 21 18 18 103 103 – Source: Word Bank, 2009. Note: This table reports officially recorded remittances; the true size of remittances, including unrecorded flows through formal and informal channels, is believed to be larger.
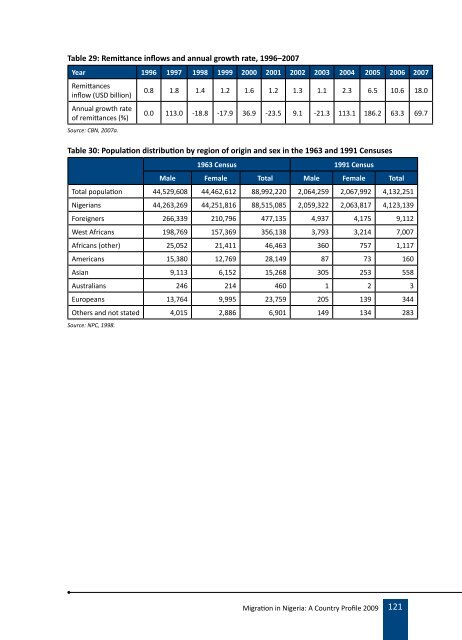
Table 29: Remittance inflows and annual growth rate, 1996–2007 Year 1996 1997 1998 1999 2000 2001 2002 2003 2004 2005 2006 2007 Remittances inflow (USD billi<strong>on</strong>) Annual growth rate of remittances (%) Source: CBN, 2007a. 0.8 1.8 1.4 1.2 1.6 1.2 1.3 1.1 2.3 6.5 10.6 18.0 0.0 113.0 -18.8 -17.9 36.9 -23.5 9.1 -21.3 113.1 186.2 63.3 69.7 Table 30: Populati<strong>on</strong> distributi<strong>on</strong> by regi<strong>on</strong> of origin and sex in the 1963 and 1991 Censuses 1963 Census 1991 Census Male Female Total Male Female Total Total populati<strong>on</strong> 44,529,608 44,462,612 88,992,220 2,064,259 2,067,992 4,132,251 <strong>Nigeria</strong>ns 44,263,269 44,251,816 88,515,085 2,059,322 2,063,817 4,123,139 Foreigners 266,339 210,796 477,135 4,937 4,175 9,112 West Africans 198,769 157,369 356,138 3,793 3,214 7,007 Africans (other) 25,052 21,411 46,463 360 757 1,117 Americans 15,380 12,769 28,149 87 73 160 Asian 9,113 6,152 15,268 305 253 558 Australians 246 214 460 1 2 3 Europeans 13,764 9,995 23,759 205 139 344 Others and not stated 4,015 2,886 6,901 149 134 283 Source: NPC, 1998. <str<strong>on</strong>g>Migrati<strong>on</strong></str<strong>on</strong>g> in <strong>Nigeria</strong>: A Country <str<strong>on</strong>g>Profile</str<strong>on</strong>g> 2009 121
- Page 1 and 2:
This publication has been co-financ
- Page 3:
This publication has been co-financ
- Page 7 and 8:
conTenTs List of tables ...........
- Page 9 and 10:
list of tables Table 1: Trends in p
- Page 11 and 12:
acronyms AVR Assisted voluntary ret
- Page 13 and 14:
Foreword Over the past three years,
- Page 15:
NIGERIA - Basic facts Population (2
- Page 18 and 19:
Estimates made by the Development R
- Page 20 and 21:
Part of the problem is the lack of
- Page 23 and 24:
ésumé L’immigration au Nigéria
- Page 25 and 26:
2007. Cet accroissement a eu lieu m
- Page 27 and 28:
En outre, ce projet de politique pr
- Page 29 and 30:
parT a: introduction Part A of the
- Page 31 and 32:
Nigerians that is likely to be a
- Page 33:
the gender difference was slight, b
- Page 36 and 37:
Figure 2: Population of Nigeria by
- Page 38 and 39:
the two census years, 1991 and 2006
- Page 40 and 41:
this report had been carried out be
- Page 42 and 43:
infrastructure, food security and a
- Page 44 and 45:
address existing problems that are
- Page 46 and 47:
school level has also been increasi
- Page 49 and 50:
parT c: analysis of the migration s
- Page 51 and 52:
2000 and 2005 Nigeria recorded a 5.
- Page 53 and 54:
However, Table 7 indicates fluctuat
- Page 55 and 56:
Students No recent data on students
- Page 57 and 58:
pilgrimage, sexual exploitation, do
- Page 59 and 60:
Despite this, Table 7 and Table 25
- Page 61 and 62:
Students From 2000 to 2006, the num
- Page 63 and 64:
Trafficking and smuggling in person
- Page 65 and 66:
2007 (CBN, 2007b), as shown in Tabl
- Page 67 and 68:
parT D: Factors driving migration D
- Page 69:
It is often less the lack of employ
- Page 72 and 73: with a view to its finalization. Su
- Page 74 and 75: of the Federal Republic of Nigeria
- Page 76 and 77: persons in Nigeria and, in 2009, un
- Page 78 and 79: - drafting of bills and other legal
- Page 80 and 81: - to strengthen and enhance effecti
- Page 82 and 83: Despite the lack of an official coo
- Page 84 and 85: The strategic approach used is desi
- Page 86 and 87: Bilateral agreements The following
- Page 88 and 89: created, they lack the appropriate
- Page 91 and 92: parT F: evaluating the consequences
- Page 93 and 94: parT g: conclusions g.1 main findin
- Page 95 and 96: improved in order to promote a more
- Page 97 and 98: (ECCAS) (for example, the 2001 ECOW
- Page 99 and 100: eferences Aboderin, I. 2007 Context
- Page 101 and 102: Docquier, F. and A. Bhargava 2006 M
- Page 103 and 104: National Agency for the Prohibition
- Page 105 and 106: Universal Basic Education Commissio
- Page 107 and 108: annex: statistics Figure 8: Nationa
- Page 109 and 110: Figure 12: Net period migration by
- Page 111 and 112: Table 9: Tuberculosis prevalence ra
- Page 113 and 114: Table 12: Population and migration
- Page 115 and 116: Table 16: Graduate output: bachelor
- Page 117 and 118: Table 19: Refugees in Nigeria by na
- Page 119 and 120: Table 21: Distribution of employed
- Page 121: Russian Federation 2 0 2 South Afri