Migration Profile on Nigeria - IOM Publications - International ...
Migration Profile on Nigeria - IOM Publications - International ...
Migration Profile on Nigeria - IOM Publications - International ...

You also want an ePaper? Increase the reach of your titles
YUMPU automatically turns print PDFs into web optimized ePapers that Google loves.
parT b: analysis of the socio-ec<strong>on</strong>omic c<strong>on</strong>text<br />
of migrati<strong>on</strong><br />
b.1 Demographic changes<br />
The human resources of <strong>Nigeria</strong> are another measure of the level of<br />
development of the country. <strong>Nigeria</strong> is the most populous country in Africa<br />
and <strong>on</strong>e of the ten most populous in the world. Its populati<strong>on</strong> volume has<br />
been increasing tremendously, from 88.99 milli<strong>on</strong> in 1991 (NPC, 1991) to an<br />
estimated volume of 126.2 milli<strong>on</strong> (2003), 129.9 milli<strong>on</strong> (2004), 133.5 milli<strong>on</strong><br />
(2005) and 140 milli<strong>on</strong> by 2006 (CBN, 2007a). The latest estimate put it at<br />
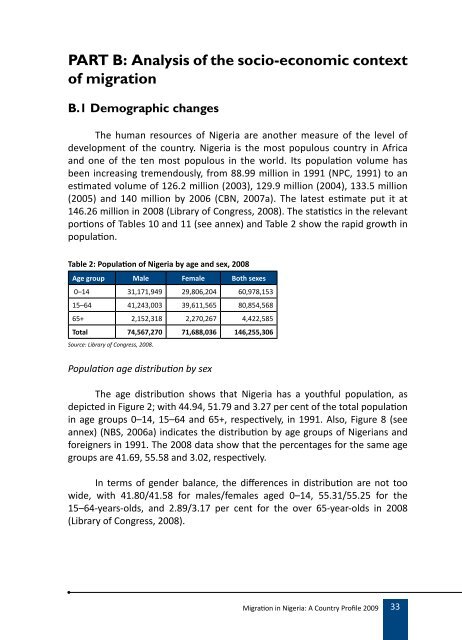
146.26 milli<strong>on</strong> in 2008 (Library of C<strong>on</strong>gress, 2008). The statistics in the relevant<br />
porti<strong>on</strong>s of Tables 10 and 11 (see annex) and Table 2 show the rapid growth in<br />
populati<strong>on</strong>.<br />
Table 2: Populati<strong>on</strong> of <strong>Nigeria</strong> by age and sex, 2008<br />
Age group Male Female Both sexes<br />
0–14 31,171,949 29,806,204 60,978,153<br />
15–64 41,243,003 39,611,565 80,854,568<br />
65+ 2,152,318 2,270,267 4,422,585<br />
Total 74,567,270 71,688,036 146,255,306<br />
Source: Library of C<strong>on</strong>gress, 2008.<br />
Populati<strong>on</strong> age distributi<strong>on</strong> by sex<br />
The age distributi<strong>on</strong> shows that <strong>Nigeria</strong> has a youthful populati<strong>on</strong>, as<br />
depicted in Figure 2; with 44.94, 51.79 and 3.27 per cent of the total populati<strong>on</strong><br />
in age groups 0–14, 15–64 and 65+, respectively, in 1991. Also, Figure 8 (see<br />
annex) (NBS, 2006a) indicates the distributi<strong>on</strong> by age groups of <strong>Nigeria</strong>ns and<br />
foreigners in 1991. The 2008 data show that the percentages for the same age<br />
groups are 41.69, 55.58 and 3.02, respectively.<br />
In terms of gender balance, the differences in distributi<strong>on</strong> are not too<br />
wide, with 41.80/41.58 for males/females aged 0–14, 55.31/55.25 for the<br />
15–64-years-olds, and 2.89/3.17 per cent for the over 65-year-olds in 2008<br />
(Library of C<strong>on</strong>gress, 2008).<br />
<str<strong>on</strong>g>Migrati<strong>on</strong></str<strong>on</strong>g> in <strong>Nigeria</strong>: A Country <str<strong>on</strong>g>Profile</str<strong>on</strong>g> 2009<br />
33