JNNURM - GANGAPEDIA
JNNURM - GANGAPEDIA
JNNURM - GANGAPEDIA

You also want an ePaper? Increase the reach of your titles
YUMPU automatically turns print PDFs into web optimized ePapers that Google loves.
City Development Plan for Agra City in the state of Uttar Pradesh under <strong>JNNURM</strong><br />
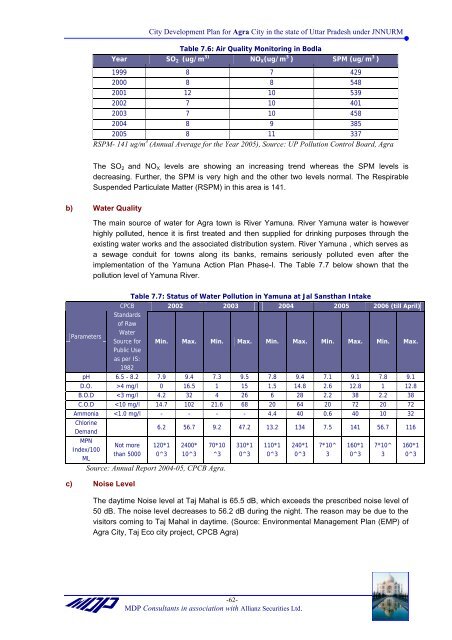
Table 7.6: Air Quality Monitoring in Bodla<br />
Year SO 2 (ug/m 3) NO X(ug/m 3 ) SPM (ug/m 3 )<br />
1999 8 7 429<br />
2000 8 8 548<br />
2001 12 10 539<br />
2002 7 10 401<br />
2003 7 10 458<br />
2004 8 9 385<br />
2005 8 11 337<br />
RSPM- 141 ug/m 3 (Annual Average for the Year 2005), Source: UP Pollution Control Board, Agra<br />
The SO2 and NOX levels are showing an increasing trend whereas the SPM levels is<br />
decreasing. Further, the SPM is very high and the other two levels normal. The Respirable<br />
Suspended Particulate Matter (RSPM) in this area is 141.<br />
b) Water Quality<br />
Parameters<br />
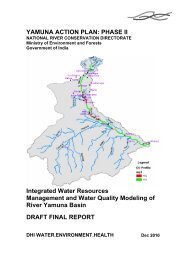
The main source of water for Agra town is River Yamuna. River Yamuna water is however<br />
highly polluted, hence it is first treated and then supplied for drinking purposes through the<br />
existing water works and the associated distribution system. River Yamuna , which serves as<br />
a sewage conduit for towns along its banks, remains seriously polluted even after the<br />
implementation of the Yamuna Action Plan Phase-I. The Table 7.7 below shown that the<br />
pollution level of Yamuna River.<br />
CPCB<br />
Standards<br />
of Raw<br />
Water<br />
Source for<br />
Public Use<br />
as per IS:<br />
1982<br />
Table 7.7: Status of Water Pollution in Yamuna at Jal Sansthan Intake<br />
2002 2003 2004 2005 2006 (till April)<br />
Min. Max. Min. Max. Min. Max. Min. Max. Min. Max.<br />
pH 6.5 - 8.2 7.9 9.4 7.3 9.5 7.8 9.4 7.1 9.1 7.8 9.1<br />
D.O. >4 mg/l 0 16.5 1 15 1.5 14.8 2.6 12.8 1 12.8<br />
B.O.D