Site selection and carrying capacity in Mediterranean ... - FAO Sipam
Site selection and carrying capacity in Mediterranean ... - FAO Sipam
Site selection and carrying capacity in Mediterranean ... - FAO Sipam

Create successful ePaper yourself
Turn your PDF publications into a flip-book with our unique Google optimized e-Paper software.
92 GFCM:XXXV/2011/Dma.9<br />
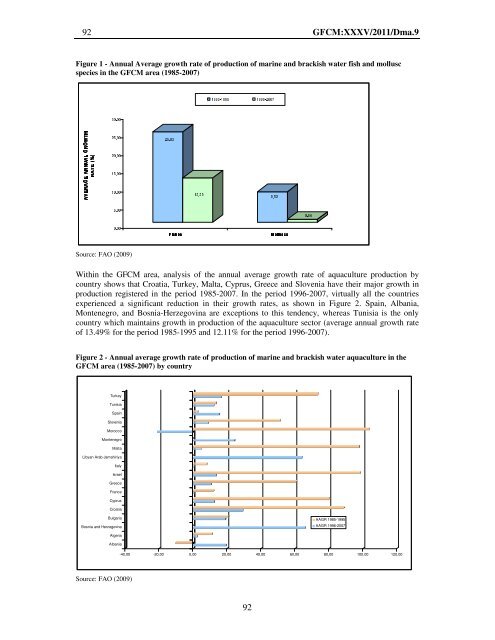
Figure 1 - Annual Average growth rate of production of mar<strong>in</strong>e <strong>and</strong> brackish water fish <strong>and</strong> mollusc<br />
species <strong>in</strong> the GFCM area (1985-2007)<br />
30,00<br />
Source: <strong>FAO</strong> (2009)<br />
5,00 10,00 15,00 20,00 25,00<br />
AVERAGE ANUAL GROWTH<br />
AVERAGE ANUAL GROWTH<br />
AVERAGE ANUAL GROWTH<br />
AVERAGE ANUAL GROWTH<br />
RATE (%)RATE (%)<br />
0,00<br />
With<strong>in</strong> the GFCM area, analysis of the annual average growth rate of aquaculture production by<br />
country shows that Croatia, Turkey, Malta, Cyprus, Greece <strong>and</strong> Slovenia have their major growth <strong>in</strong><br />
production registered <strong>in</strong> the period 1985-2007. In the period 1996-2007, virtually all the countries<br />
experienced a significant reduction <strong>in</strong> their growth rates, as shown <strong>in</strong> Figure 2. Spa<strong>in</strong>, Albania,<br />
Montenegro, <strong>and</strong> Bosnia-Herzegov<strong>in</strong>a are exceptions to this tendency, whereas Tunisia is<br />
12,29<br />
the<br />
8,52<br />
only<br />
country which ma<strong>in</strong>ta<strong>in</strong>s growth <strong>in</strong> production of the aquaculture sector (average annual growth rate<br />
of 13.49% for the period 1985-1995 <strong>and</strong> 12.11% for<br />
0,84 Fishes Molluscs<br />
the period 1996-2007).<br />
Figure 2 - Annual average growth rate of production of mar<strong>in</strong>e <strong>and</strong> brackish water aquaculture <strong>in</strong> the<br />
GFCM area (1985-2007) by country<br />
Turkey<br />
Tunisia<br />
Spa<strong>in</strong><br />
Slovenia<br />
Morocco<br />
Montenegro<br />
Malta<br />
Libyan Arab Jamahiriya<br />
Italy<br />
Israel<br />
Greece<br />
France<br />
Cyprus<br />
Croatia<br />
Bulgaria<br />
Bosnia <strong>and</strong> Herzegov<strong>in</strong>a<br />
Algeria<br />
Albania<br />
Source: <strong>FAO</strong> (2009)<br />
1985-1995 1996-2007<br />
25,03<br />
Molluscs Fishes<br />
-40,00 -20,00 0,00 20,00 40,00 60,00 80,00 100,00 120,00<br />
92<br />
AAGR 1985-1995<br />
AAGR 1996-2007