Atlas Copco - Annual Report 1999
Atlas Copco - Annual Report 1999
Atlas Copco - Annual Report 1999

You also want an ePaper? Increase the reach of your titles
YUMPU automatically turns print PDFs into web optimized ePapers that Google loves.
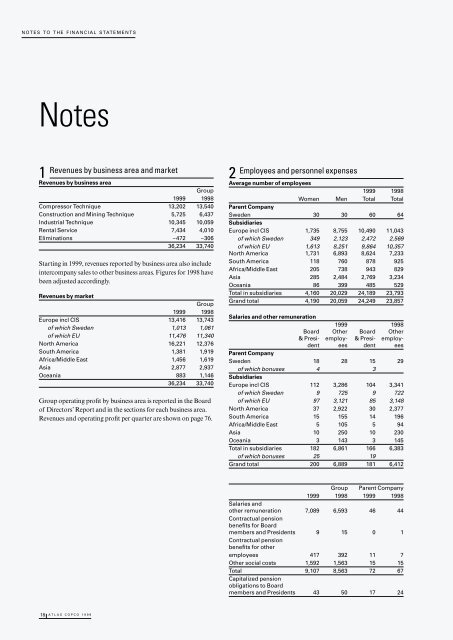
NOTES TO THE FINANCIAL STATEMENTS<br />
Notes<br />
1<br />
Revenues by business area and market<br />
Revenues by business area<br />
<strong>1999</strong><br />
Group<br />
1998<br />
Compressor Technique 13,202 13,540<br />
Construction and Mining Technique 5,725 6,437<br />
Industrial Technique 10,345 10,059<br />
Rental Service 7,434 4,010<br />
Eliminations –472 –306<br />
36,234 33,740<br />
Starting in <strong>1999</strong>, revenues reported by business area also include<br />
intercompany sales to other business areas. Figures for 1998 have<br />
been adjusted accordingly.<br />
Revenues by market<br />
<strong>1999</strong><br />
Group<br />
1998<br />
Europe incl CIS 13,416 13,743<br />
of which Sweden 1,013 1,061<br />
of which EU 11,476 11,340<br />
North America 16,221 12,376<br />
South America 1,381 1,919<br />
Africa/Middle East 1,456 1,619<br />
Asia 2,877 2,937<br />
Oceania 883 1,146<br />
36,234 33,740<br />
Group operating profit by business area is reported in the Board<br />
of Directors’ <strong>Report</strong> and in the sections for each business area.<br />
Revenues and operating profit per quarter are shown on page 76.<br />
18 ATLAS COPCO <strong>1999</strong><br />
2<br />
Employees and personnel expenses<br />
Average number of employees<br />
<strong>1999</strong> 1998<br />
Women Men Total Total<br />
Parent Company<br />
Sweden<br />
Subsidiaries<br />
30 30 60 64<br />
Europe incl CIS 1,735 8,755 10,490 11,043<br />
of which Sweden 349 2,123 2,472 2,569<br />
of which EU 1,613 8,251 9,864 10,357<br />
North America 1,731 6,893 8,624 7,233<br />
South America 118 760 878 925<br />
Africa/Middle East 205 738 943 829<br />
Asia 285 2,484 2,769 3,234<br />
Oceania 86 399 485 529<br />
Total in subsidiaries 4,160 20,029 24,189 23,793<br />
Grand total 4,190 20,059 24,249 23,857<br />
Salaries and other remuneration<br />
<strong>1999</strong> 1998<br />
Board Other Board Other<br />
& Presi- employ- & Presi- employdent<br />
ees dent ees<br />
Parent Company<br />
Sweden 18 28 15 29<br />
of which bonuses<br />
Subsidiaries<br />
4 3<br />
Europe incl CIS 112 3,286 104 3,341<br />
of which Sweden 9 725 9 722<br />
of which EU 97 3,121 85 3,148<br />
North America 37 2,922 30 2,377<br />
South America 15 155 14 196<br />
Africa/Middle East 5 105 5 94<br />
Asia 10 250 10 230<br />
Oceania 3 143 3 145<br />
Total in subsidiaries 182 6,861 166 6,383<br />
of which bonuses 25 19<br />
Grand total 200 6,889 181 6,412<br />
Group Parent Company<br />
<strong>1999</strong> 1998 <strong>1999</strong> 1998<br />
Salaries and<br />
other remuneration<br />
Contractual pension<br />
benefits for Board<br />
7,089 6,593 46 44<br />
members and Presidents<br />
Contractual pension<br />
benefits for other<br />
9 15 0 1<br />
employees 417 392 11 7<br />
Other social costs 1,592 1,563 15 15<br />
Total<br />
Capitalized pension<br />
obligations to Board<br />
9,107 8,563 72 67<br />
members and Presidents 43 50 17 24