Atlas Copco - Annual Report 1999
Atlas Copco - Annual Report 1999
Atlas Copco - Annual Report 1999
You also want an ePaper? Increase the reach of your titles
YUMPU automatically turns print PDFs into web optimized ePapers that Google loves.
THE ATLAS COPCO SHARE<br />
Share risk<br />
The <strong>Atlas</strong> <strong>Copco</strong> share’s beta value provides an assessment<br />
of its risk. The beta value is a relative measure of the risk<br />
attached to the share, reflecting how it has tracked the stock<br />
exchange index during the preceding 48 months. At December<br />
31, <strong>1999</strong>, the beta value of the <strong>Atlas</strong> <strong>Copco</strong> A share on the<br />
Stockholm Stock Exchange was 0.77 (0.91). This means that<br />
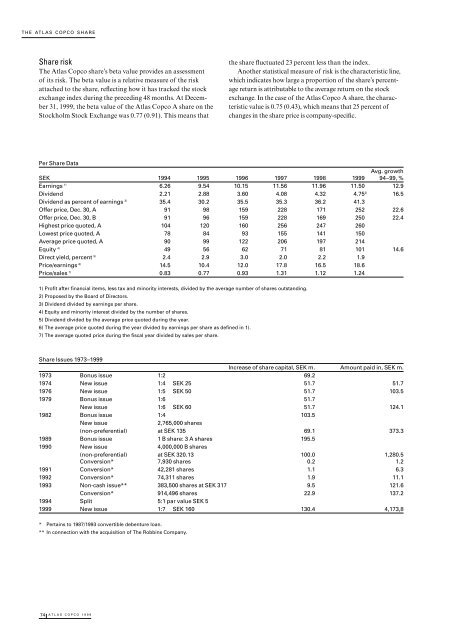
Per Share Data<br />
SEK 1994 1995 1996 1997 1998 <strong>1999</strong><br />
Avg. growth<br />
94–99, %<br />
Earnings 1) 6.26 9.54 10.15 11.56 11.96 11.50 12.9<br />
Dividend 2.21 2.88 3.60 4.08 4.32 4.752) 16.5<br />
Dividend as percent of earnings 3) 35.4 30.2 35.5 35.3 36.2 41.3<br />
Offer price, Dec. 30, A 91 98 159 228 171 252 22.6<br />
Offer price, Dec. 30, B 91 96 159 228 169 250 22.4<br />
Highest price quoted, A 104 120 160 256 247 260<br />
Lowest price quoted, A 78 84 93 155 141 150<br />
Average price quoted, A 90 99 122 206 197 214<br />
Equity 4) 49 56 62 71 81 101 14.6<br />
Direct yield, percent 5) 2.4 2.9 3.0 2.0 2.2 1.9<br />
Price/earnings 6) 14.5 10.4 12.0 17.8 16.5 18.6<br />
Price/sales 7) 0.83 0.77 0.93 1.31 1.12 1.24<br />
1) Profit after financial items, less tax and minority interests, divided by the average number of shares outstanding.<br />
2) Proposed by the Board of Directors.<br />
3) Dividend divided by earnings per share.<br />
4) Equity and minority interest divided by the number of shares.<br />
5) Dividend divided by the average price quoted during the year.<br />
6) The average price quoted during the year divided by earnings per share as defined in 1).<br />
7) The average quoted price during the fiscal year divided by sales per share.<br />
Share Issues 1973–<strong>1999</strong><br />
Increase of share capital, SEK m. Amount paid in, SEK m.<br />
1973 Bonus issue 1:2 69.2<br />
1974 New issue 1:4 SEK 25 51.7 51.7<br />
1976 New issue 1:5 SEK 50 51.7 103.5<br />
1979 Bonus issue 1:6 51.7<br />
New issue 1:6 SEK 60 51.7 124.1<br />
1982 Bonus issue 1:4 103.5<br />
New issue 2,765,000 shares<br />
(non-preferential) at SEK 135 69.1 373.3<br />
1989 Bonus issue 1 B share: 3 A shares 195.5<br />
1990 New issue 4,000,000 B shares<br />
(non-preferential) at SEK 320.13 100.0 1,280.5<br />
Conversion* 7,930 shares 0.2 1.2<br />
1991 Conversion* 42,281 shares 1.1 6.3<br />
1992 Conversion* 74,311 shares 1.9 11.1<br />
1993 Non-cash issue** 383,500 shares at SEK 317 9.5 121.6<br />
Conversion* 914,496 shares 22.9 137.2<br />
1994 Split 5:1 par value SEK 5<br />
<strong>1999</strong> New issue 1:7 SEK 160 130.4 4,173,8<br />
* Pertains to 1987/1993 convertible debenture loan.<br />
** In connection with the acquisition of The Robbins Company.<br />
74 ATLAS COPCO <strong>1999</strong><br />
the share fluctuated 23 percent less than the index.<br />
Another statistical measure of risk is the characteristic line,<br />
which indicates how large a proportion of the share’s percentage<br />
return is attributable to the average return on the stock<br />
exchange. In the case of the <strong>Atlas</strong> <strong>Copco</strong> A share, the characteristic<br />
value is 0.75 (0.43), which means that 25 percent of<br />
changes in the share price is company-specific.


