Atlas Copco - Annual Report 1999
Atlas Copco - Annual Report 1999
Atlas Copco - Annual Report 1999

Create successful ePaper yourself
Turn your PDF publications into a flip-book with our unique Google optimized e-Paper software.
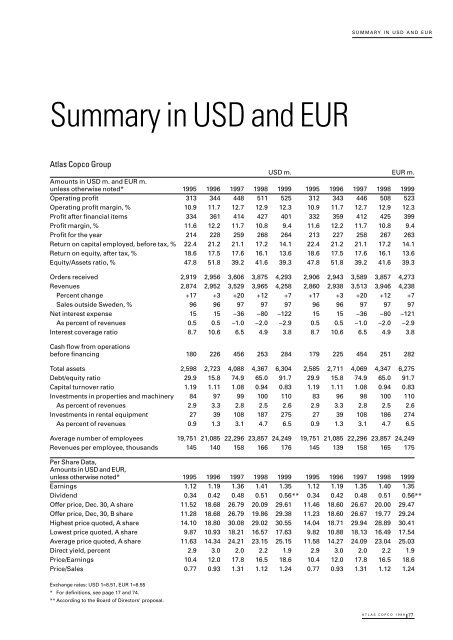
Summary in USD and EUR<br />
<strong>Atlas</strong> <strong>Copco</strong> Group<br />
SUMMARY IN USD AND EUR<br />
USD m. EUR m.<br />
Amounts in USD m. and EUR m.<br />
unless otherwise noted* 1995 1996 1997 1998 <strong>1999</strong> 1995 1996 1997 1998 <strong>1999</strong><br />
Operating profit 313 344 448 511 525 312 343 446 508 523<br />
Operating profit margin, % 10.9 11.7 12.7 12.9 12.3 10.9 11.7 12.7 12.9 12.3<br />
Profit after financial items 334 361 414 427 401 332 359 412 425 399<br />
Profit margin, % 11.6 12.2 11.7 10.8 9.4 11.6 12.2 11.7 10.8 9.4<br />
Profit for the year 214 228 259 268 264 213 227 258 267 263<br />
Return on capital employed, before tax, % 22.4 21.2 21.1 17.2 14.1 22.4 21.2 21.1 17.2 14.1<br />
Return on equity, after tax, % 18.6 17.5 17.6 16.1 13.6 18.6 17.5 17.6 16.1 13.6<br />
Equity/Assets ratio, % 47.8 51.8 39.2 41.6 39.3 47.8 51.8 39.2 41.6 39.3<br />
Orders received 2,919 2,956 3,606 3,875 4,293 2,906 2,943 3,589 3,857 4,273<br />
Revenues 2,874 2,952 3,529 3,965 4,258 2,860 2,938 3,513 3,946 4,238<br />
Percent change +17 +3 +20 +12 +7 +17 +3 +20 +12 +7<br />
Sales outside Sweden, % 96 96 97 97 97 96 96 97 97 97<br />
Net interest expense 15 15 –36 –80 –122 15 15 –36 –80 –121<br />
As percent of revenues 0.5 0.5 –1.0 –2.0 –2.9 0.5 0.5 –1.0 –2.0 –2.9<br />
Interest coverage ratio 8.7 10.6 6.5 4.9 3.8 8.7 10.6 6.5 4.9 3.8<br />
Cash flow from operations<br />
before financing 180 226 456 253 284 179 225 454 251 282<br />
Total assets 2,598 2,723 4,088 4,367 6,304 2,585 2,711 4,069 4,347 6,275<br />
Debt/equity ratio 29.9 15.8 74.9 65.0 91.7 29.9 15.8 74.9 65.0 91.7<br />
Capital turnover ratio 1.19 1.11 1.08 0.94 0.83 1.19 1.11 1.08 0.94 0.83<br />
Investments in properties and machinery 84 97 99 100 110 83 96 98 100 110<br />
As percent of revenues 2.9 3.3 2.8 2.5 2.6 2.9 3.3 2.8 2.5 2.6<br />
Investments in rental equipment 27 39 108 187 275 27 39 108 186 274<br />
As percent of revenues 0.9 1.3 3.1 4.7 6.5 0.9 1.3 3.1 4.7 6.5<br />
Average number of employees 19,751 21,085 22,296 23,857 24,249 19,751 21,085 22,296 23,857 24,249<br />
Revenues per employee, thousands 145 140 158 166 176 145 139 158 165 175<br />
Per Share Data,<br />
Amounts in USD and EUR,<br />
unless otherwise noted* 1995 1996 1997 1998 <strong>1999</strong> 1995 1996 1997 1998 <strong>1999</strong><br />
Earnings 1.12 1.19 1.36 1.41 1.35 1.12 1.19 1.35 1.40 1.35<br />
Dividend 0.34 0.42 0.48 0.51 0.56** 0.34 0.42 0.48 0.51 0.56**<br />
Offer price, Dec. 30, A share 11.52 18.68 26.79 20.09 29.61 11.46 18.60 26.67 20.00 29.47<br />
Offer price, Dec, 30, B share 11.28 18.68 26.79 19.86 29.38 11.23 18.60 26.67 19.77 29.24<br />
Highest price quoted, A share 14.10 18.80 30.08 29.02 30.55 14.04 18.71 29.94 28.89 30.41<br />
Lowest price quoted, A share 9.87 10.93 18.21 16.57 17.63 9.82 10.88 18.13 16.49 17.54<br />
Average price quoted, A share 11.63 14.34 24.21 23.15 25.15 11.58 14.27 24.09 23.04 25.03<br />
Direct yield, percent 2.9 3.0 2.0 2.2 1.9 2.9 3.0 2.0 2.2 1.9<br />
Price/Earnings 10.4 12.0 17.8 16.5 18.6 10.4 12.0 17.8 16.5 18.6<br />
Price/Sales 0.77 0.93 1.31 1.12 1.24 0.77 0.93 1.31 1.12 1.24<br />
Exchange rates: USD 1=8.51, EUR 1=8.55<br />
* For definitions, see page 17 and 74.<br />
** According to the Board of Directors’ proposal.<br />
ATLAS COPCO <strong>1999</strong> 77