St. Charles County Transportation Plan 2030 - East-West Gateway ...
St. Charles County Transportation Plan 2030 - East-West Gateway ...
St. Charles County Transportation Plan 2030 - East-West Gateway ...

You also want an ePaper? Increase the reach of your titles
YUMPU automatically turns print PDFs into web optimized ePapers that Google loves.
When a new interchange is built east of Callahan Rd., replacing the two signalized intersections, it<br />
also is very likely to attract new commercial development.<br />
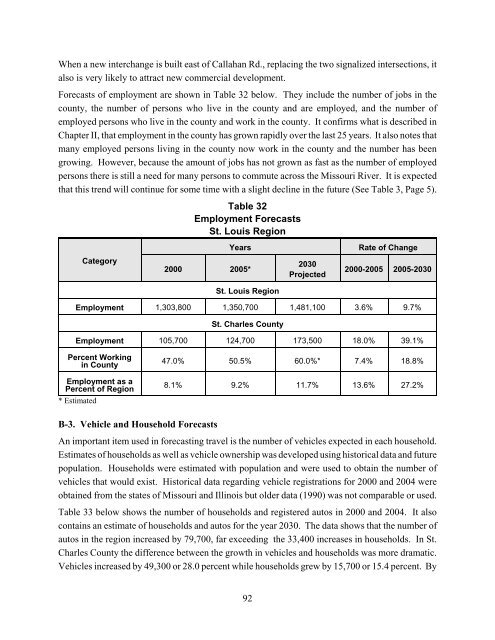
Forecasts of employment are shown in Table 32 below. They include the number of jobs in the<br />
county, the number of persons who live in the county and are employed, and the number of<br />
employed persons who live in the county and work in the county. It confirms what is described in<br />
Chapter II, that employment in the county has grown rapidly over the last 25 years. It also notes that<br />
many employed persons living in the county now work in the county and the number has been<br />
growing. However, because the amount of jobs has not grown as fast as the number of employed<br />
persons there is still a need for many persons to commute across the Missouri River. It is expected<br />
that this trend will continue for some time with a slight decline in the future (See Table 3, Page 5).<br />
Category<br />
Table 32<br />
Employment Forecasts<br />
<strong>St</strong>. Louis Region<br />
2000 2005*<br />
Years Rate of Change<br />
<strong>St</strong>. Louis Region<br />
92<br />
<strong>2030</strong><br />
Projected<br />
2000-2005 2005-<strong>2030</strong><br />
Employment 1,303,800 1,350,700 1,481,100 3.6% 9.7%<br />
<strong>St</strong>. <strong>Charles</strong> <strong>County</strong><br />
Employment 105,700 124,700 173,500 18.0% 39.1%<br />
Percent Working<br />
in <strong>County</strong><br />
Employment as a<br />
Percent of Region<br />
* Estimated<br />
B-3. Vehicle and Household Forecasts<br />
47.0% 50.5% 60.0%* 7.4% 18.8%<br />
8.1% 9.2% 11.7% 13.6% 27.2%<br />
An important item used in forecasting travel is the number of vehicles expected in each household.<br />
Estimates of households as well as vehicle ownership was developed using historical data and future<br />
population. Households were estimated with population and were used to obtain the number of<br />
vehicles that would exist. Historical data regarding vehicle registrations for 2000 and 2004 were<br />
obtained from the states of Missouri and Illinois but older data (1990) was not comparable or used.<br />
Table 33 below shows the number of households and registered autos in 2000 and 2004. It also<br />
contains an estimate of households and autos for the year <strong>2030</strong>. The data shows that the number of<br />
autos in the region increased by 79,700, far exceeding the 33,400 increases in households. In <strong>St</strong>.<br />
<strong>Charles</strong> <strong>County</strong> the difference between the growth in vehicles and households was more dramatic.<br />
Vehicles increased by 49,300 or 28.0 percent while households grew by 15,700 or 15.4 percent. By