St. Charles County Transportation Plan 2030 - East-West Gateway ...
St. Charles County Transportation Plan 2030 - East-West Gateway ...
St. Charles County Transportation Plan 2030 - East-West Gateway ...

Create successful ePaper yourself
Turn your PDF publications into a flip-book with our unique Google optimized e-Paper software.
No. Road<br />
Segment Crashes<br />
From To Miles 2002 2003 2004<br />
78<br />
3 Yr<br />
Total<br />
2004<br />
ADTs<br />
Crash<br />
Rate<br />
39Rt. D Rt. 94 Rt. DD 5.9 26 33 30 89 7400 188<br />
40Elm <strong>St</strong>. Rt. 370 Kingshighway 3.7 28 17 31 76 10000 188<br />
41I-70 Bryan Rd. Lake <strong>St</strong>. L 2.0 101 112 103 316 75900 187<br />
42Knaust Rd. Mexico Rd. Birdie Hills Rd. 2.5 21 15 5 41 8000 187<br />
43I-70 Rt. 79 Rt. K/M 2.6 203 204 216 623 115600 187<br />
44I-70 Zumbehl Cave Spgs 1.8 143 179 164 486 141700 175<br />
45U.S. 40/61 Rt. K Rt. N 5.2 129 180 142 451 46100 173<br />
46Rt. 370 <strong>St</strong>. L. Co. Rt. 94 0.6 23 17 22 62 56800 166<br />
47I-70 Rt. 94 Zumbehl 1.4 124 131 125 380 155000 162<br />
48Birdie Hills Mexico Rd. Weiss Rd. 1.7 13 7 10 30 10000 161<br />
49I-64 <strong>St</strong>. L. Co. Rt. K 3.2 202 165 72 439 77500 161<br />
50Rt. 79 Rt. M Lincoln Co. 6.4 38 53 44 135 13300 145<br />
51I-70 Cave Spgs Rt. 370 1.8 106 109 126 341 124400 141<br />
52U.S. 67 <strong>St</strong>. L. Co. Alton, IL 4.1<br />
62 44 53 159 25800<br />
136<br />
53Harry Truman Blvd. Rt. 370 I-70 2.2 6 9 10 25 8000 130<br />
54I-70 Lake <strong>St</strong>. L U.S. 40/61 3.6 86 135 108 329 66400 126<br />
55I-70 Pearce Blvd. Warren Co. 4.9 135 91 149 375 56400 124<br />
56Bryan Rd. I-70 Rt. N 2.7 18 27 38 83 25000 112<br />
57U.S. 61 I-70 Lincoln Co. 7.3 110 75 102 287 33000 109<br />
58Caulks Hill Rd. Harvester Rd. Greens Bottom Rd. 2.5 10 19 18 47 17000 101<br />
Totals = 218.6 5815 5619 5713 17147 Average = 313<br />
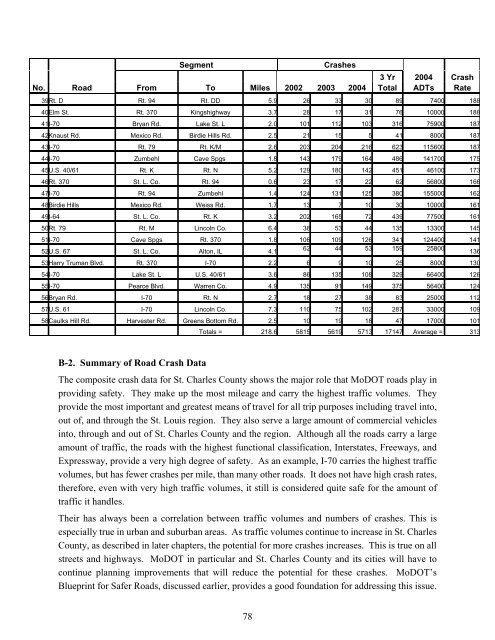
B-2. Summary of Road Crash Data<br />
The composite crash data for <strong>St</strong>. <strong>Charles</strong> <strong>County</strong> shows the major role that MoDOT roads play in<br />
providing safety. They make up the most mileage and carry the highest traffic volumes. They<br />
provide the most important and greatest means of travel for all trip purposes including travel into,<br />
out of, and through the <strong>St</strong>. Louis region. They also serve a large amount of commercial vehicles<br />
into, through and out of <strong>St</strong>. <strong>Charles</strong> <strong>County</strong> and the region. Although all the roads carry a large<br />
amount of traffic, the roads with the highest functional classification, Interstates, Freeways, and<br />
Expressway, provide a very high degree of safety. As an example, I-70 carries the highest traffic<br />
volumes, but has fewer crashes per mile, than many other roads. It does not have high crash rates,<br />
therefore, even with very high traffic volumes, it still is considered quite safe for the amount of<br />
traffic it handles.<br />
Their has always been a correlation between traffic volumes and numbers of crashes. This is<br />
especially true in urban and suburban areas. As traffic volumes continue to increase in <strong>St</strong>. <strong>Charles</strong><br />
<strong>County</strong>, as described in later chapters, the potential for more crashes increases. This is true on all<br />
streets and highways. MoDOT in particular and <strong>St</strong>. <strong>Charles</strong> <strong>County</strong> and its cities will have to<br />
continue planning improvements that will reduce the potential for these crashes. MoDOT’s<br />
Blueprint for Safer Roads, discussed earlier, provides a good foundation for addressing this issue.