<strong>County</strong> Preservation Table 28 <strong>Transportation</strong> Improvement Program FY 2007 - 2010 MoDOT Projects Capacity Adding Operational & Safety 86 Other Total % of Total Franklin $21,656,000 $59,663,000 $1,274,000 $0 $82,593,000 7.3% Jefferson $25,189,000 $0 $45,073,000 $0 $70,262,000 6.2% <strong>St</strong>. <strong>Charles</strong> $8,699,000 $77,709,000 $2,223,000 $304,000 $88,935,000 7.9% <strong>St</strong>. Louis $526,142,000 $34,636,000 $11,917,000 $11,217,000 $583,912,000 51.6% <strong>St</strong>. Louis City $126,724,000 $0 $727,000 $70,000 $127,521,000 11.3% Multi-<strong>County</strong> $18,369,000 $0 $7,345,000 $0 $25,714,000 2.3% Regional $93,768,000 $0 $57,377,000 $2,231,000 $153,376,000 13.5% Multi-<strong>St</strong>ate $80,000 $0 $0 $0 $80,000 0.0% Total $820,627,000 $172,008,000 $125,936,000 $13,822,000 $1,132,393,00 0 % 72.5% 15.2% 11.1% 1.2% 100.0% Note: The four CMAQ projects total $11 million bringing the <strong>St</strong>. <strong>Charles</strong> <strong>County</strong> MoDOT totals to $100 million <strong>County</strong> Preservatn Table 29 <strong>Transportation</strong> Improvement Program FY 2007 - 2010 Local Projects Capacity Adding Operationl & Safety System Enhncmnts Other Total 100.0% Franklin $12,486,195 $2,361,000 $2,852,000 $2,145,499 $0 $19,844,694 6.9 Jefferson $10,038,820 $5,625,000 $6,909,600 $110,000 $219,500 $22,902,920 8.1 <strong>St</strong>. <strong>Charles</strong> $26,990,390 $617,855 $26,877,388 $2,873,000 $0 $57,358,633 20.2 <strong>St</strong>. Louis $39,574,300 $11,100,000 $30,211,099 $11,819,369 $324,000 $93,028,768 32.8 <strong>St</strong>. Louis City Multi- <strong>County</strong> % of Total $50,640,424 $0 $23,793,300 $10,591,701 $0 $85,025,425 30.0 $0 $0 $2,410,500 $1,550,000 $1,850,991 $5,811,491 2.0 Total $139,730,129 $19,703,855 $93,053,887 $29,089,569 $2,394,491 $283,971,931 100.0 % 49.2 6.9 32.8 10.3 0.8 100.0 Note: Transit Vehicle Service under Multi-county of $22,436,869 has been omitted
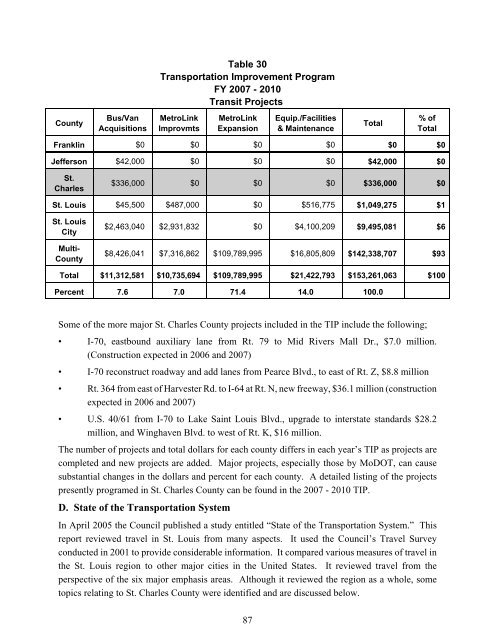
<strong>County</strong> Bus/Van Acquisitions Table 30 <strong>Transportation</strong> Improvement Program FY 2007 - 2010 Transit Projects MetroLink Improvmts MetroLink Expansion 87 Equip./Facilities & Maintenance Total % of Total Franklin $0 $0 $0 $0 $0 $0 Jefferson $42,000 $0 $0 $0 $42,000 $0 <strong>St</strong>. <strong>Charles</strong> $336,000 $0 $0 $0 $336,000 $0 <strong>St</strong>. Louis $45,500 $487,000 $0 $516,775 $1,049,275 $1 <strong>St</strong>. Louis City Multi- <strong>County</strong> $2,463,040 $2,931,832 $0 $4,100,209 $9,495,081 $6 $8,426,041 $7,316,862 $109,789,995 $16,805,809 $142,338,707 $93 Total $11,312,581 $10,735,694 $109,789,995 $21,422,793 $153,261,063 $100 Percent 7.6 7.0 71.4 14.0 100.0 Some of the more major <strong>St</strong>. <strong>Charles</strong> <strong>County</strong> projects included in the TIP include the following; • I-70, eastbound auxiliary lane from Rt. 79 to Mid Rivers Mall Dr., $7.0 million. (Construction expected in 2006 and 2007) • I-70 reconstruct roadway and add lanes from Pearce Blvd., to east of Rt. Z, $8.8 million • Rt. 364 from east of Harvester Rd. to I-64 at Rt. N, new freeway, $36.1 million (construction expected in 2006 and 2007) • U.S. 40/61 from I-70 to Lake Saint Louis Blvd., upgrade to interstate standards $28.2 million, and Winghaven Blvd. to west of Rt. K, $16 million. The number of projects and total dollars for each county differs in each year’s TIP as projects are completed and new projects are added. Major projects, especially those by MoDOT, can cause substantial changes in the dollars and percent for each county. A detailed listing of the projects presently programed in <strong>St</strong>. <strong>Charles</strong> <strong>County</strong> can be found in the 2007 - 2010 TIP. D. <strong>St</strong>ate of the <strong>Transportation</strong> System In April 2005 the Council published a study entitled “<strong>St</strong>ate of the <strong>Transportation</strong> System.” This report reviewed travel in <strong>St</strong>. Louis from many aspects. It used the Council’s Travel Survey conducted in 2001 to provide considerable information. It compared various measures of travel in the <strong>St</strong>. Louis region to other major cities in the United <strong>St</strong>ates. It reviewed travel from the perspective of the six major emphasis areas. Although it reviewed the region as a whole, some topics relating to <strong>St</strong>. <strong>Charles</strong> <strong>County</strong> were identified and are discussed below.
- Page 1 and 2:
THE ST. CHARLES COUNTY TRANSPORTATI
- Page 4 and 5:
Table of Contents (Continued) Chapt
- Page 6 and 7:
Table of Contents (Continued) Chapt
- Page 8 and 9:
List of Figures Figure Page 1. Coun
- Page 10 and 11:
List of Acronyms/Terms AASHTO Ameri
- Page 12 and 13:
investment scenarios. Also, more ac
- Page 14 and 15:
doubled, going from 46,354 to 101,7
- Page 16 and 17:
C. Present Land Use Basic inputs in
- Page 19 and 20:
Mueller Rd., Elm Point Rd., and Lit
- Page 21:
land is available for additional de
- Page 24 and 25:
Interstate highways serve traffic w
- Page 27 and 28:
other uses as well. They generally
- Page 29 and 30:
Table 4 Average Daily Traffic Volum
- Page 31:
U.S. 67 is a four-lane expressway t
- Page 35:
Figure 4 Year 2004 Average Daily Tr
- Page 39 and 40:
Rt. N has two major parts which are
- Page 41 and 42:
Table 6 Missouri River Crossings Ch
- Page 43 and 44:
Table 7 Average Daily Traffic Volum
- Page 45 and 46: adds to the amount of VMT that is f
- Page 47 and 48: Criteria Table 10 Level of Service
- Page 49 and 50: I-64 From the Missouri River to wes
- Page 51 and 52: I-70 west of U.S. 40/61 to Pearce B
- Page 53 and 54: Criteria Table 11 Level of Service
- Page 55 and 56: speed of 50 placing it at LOS C. Th
- Page 57 and 58: Jungermann Rd. This road runs from
- Page 59 and 60: B-5.5. Major Collectors Major Colle
- Page 61 and 62: U.S. 67 experienced no delays and t
- Page 63 and 64: Road Beginning End Table 14 Travel
- Page 65 and 66: southbound from I-70 to Rt. 94 was
- Page 67 and 68: • The consultant sent out questio
- Page 69 and 70: F. Aviation St. Charles County has
- Page 71: B-1.1 MoDOT Roads Number of Crashes
- Page 74 and 75: Table 16 Missouri Department of Tra
- Page 76 and 77: Crash Rates The crash rate is the b
- Page 78 and 79: Table 19 Missouri Department of Tra
- Page 80 and 81: B-1.2. Comparison of MoDOT Roads to
- Page 82 and 83: Road Table 22 St. Charles County Ma
- Page 84 and 85: Table 24 St. Charles County Major R
- Page 86 and 87: B-1.4 MoDOT and County Crash Rate C
- Page 88 and 89: No. Road Segment Crashes From To Mi
- Page 90 and 91: The Council’s long range plan dis
- Page 92 and 93: A. Background V. Present Transporta
- Page 94 and 95: St. Louis. The next or “Second Ti
- Page 98 and 99: D-1. Mode of Travel to Work For 200
- Page 100 and 101: to I-64, and Winghaven Blvd./Bryan
- Page 102 and 103: When a new interchange is built eas
- Page 104 and 105: taking into account future improvem
- Page 107: Figure 8 Year 2030 Forcasted Travel
- Page 110 and 111: 100
- Page 112 and 113: I-64 Summary Traffic volumes on I-6
- Page 114 and 115: With an additional lane eastbound (
- Page 116 and 117: By 2030 volumes are expected to rea
- Page 118 and 119: passes through the signal of the no
- Page 120 and 121: Rt. A This five-lane road runs from
- Page 122 and 123: of future travel conditions. Some m
- Page 124 and 125: Winghaven Blvd. Rt. N to I-64. Wing
- Page 126 and 127: severity, and the crash rate (crash
- Page 128 and 129: 118
- Page 130 and 131: B-1. MoDOT Roads The following part
- Page 132 and 133: 122
- Page 134 and 135: study should be low, however, impro
- Page 136 and 137: public decisions, and does not mean
- Page 139: APPENDICES
- Page 143 and 144: APPENDIX B 2030 TRAFFIC VOLUME FORE
- Page 145: Appendix B (Continued) Route/ Exist