St. Charles County Transportation Plan 2030 - East-West Gateway ...
St. Charles County Transportation Plan 2030 - East-West Gateway ...
St. Charles County Transportation Plan 2030 - East-West Gateway ...

Create successful ePaper yourself
Turn your PDF publications into a flip-book with our unique Google optimized e-Paper software.
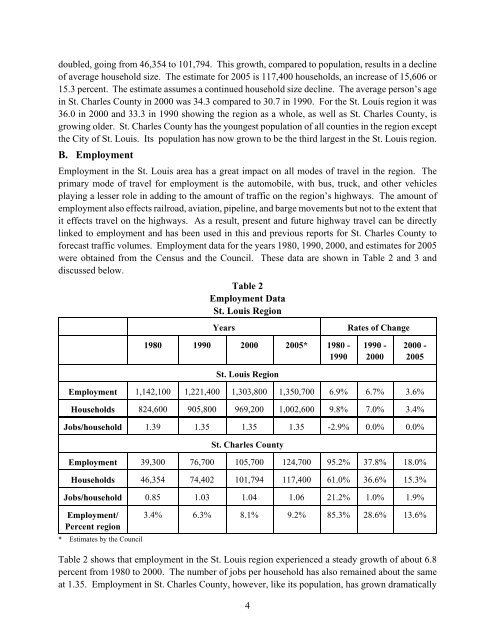
doubled, going from 46,354 to 101,794. This growth, compared to population, results in a decline<br />
of average household size. The estimate for 2005 is 117,400 households, an increase of 15,606 or<br />
15.3 percent. The estimate assumes a continued household size decline. The average person’s age<br />
in <strong>St</strong>. <strong>Charles</strong> <strong>County</strong> in 2000 was 34.3 compared to 30.7 in 1990. For the <strong>St</strong>. Louis region it was<br />
36.0 in 2000 and 33.3 in 1990 showing the region as a whole, as well as <strong>St</strong>. <strong>Charles</strong> <strong>County</strong>, is<br />
growing older. <strong>St</strong>. <strong>Charles</strong> <strong>County</strong> has the youngest population of all counties in the region except<br />
the City of <strong>St</strong>. Louis. Its population has now grown to be the third largest in the <strong>St</strong>. Louis region.<br />
B. Employment<br />
Employment in the <strong>St</strong>. Louis area has a great impact on all modes of travel in the region. The<br />
primary mode of travel for employment is the automobile, with bus, truck, and other vehicles<br />
playing a lesser role in adding to the amount of traffic on the region’s highways. The amount of<br />
employment also effects railroad, aviation, pipeline, and barge movements but not to the extent that<br />
it effects travel on the highways. As a result, present and future highway travel can be directly<br />
linked to employment and has been used in this and previous reports for <strong>St</strong>. <strong>Charles</strong> <strong>County</strong> to<br />
forecast traffic volumes. Employment data for the years 1980, 1990, 2000, and estimates for 2005<br />
were obtained from the Census and the Council. These data are shown in Table 2 and 3 and<br />
discussed below.<br />
Table 2<br />
Employment Data<br />
<strong>St</strong>. Louis Region<br />
Years Rates of Change<br />
1980 1990 2000 2005* 1980 -<br />
1990<br />
<strong>St</strong>. Louis Region<br />
4<br />
1990 -<br />
2000<br />
2000 -<br />
2005<br />
Employment 1,142,100 1,221,400 1,303,800 1,350,700 6.9% 6.7% 3.6%<br />
Households 824,600 905,800 969,200 1,002,600 9.8% 7.0% 3.4%<br />
Jobs/household 1.39 1.35 1.35 1.35 -2.9% 0.0% 0.0%<br />
<strong>St</strong>. <strong>Charles</strong> <strong>County</strong><br />
Employment 39,300 76,700 105,700 124,700 95.2% 37.8% 18.0%<br />
Households 46,354 74,402 101,794 117,400 61.0% 36.6% 15.3%<br />
Jobs/household 0.85 1.03 1.04 1.06 21.2% 1.0% 1.9%<br />
Employment/<br />
Percent region<br />
* Estimates by the Council<br />
3.4% 6.3% 8.1% 9.2% 85.3% 28.6% 13.6%<br />
Table 2 shows that employment in the <strong>St</strong>. Louis region experienced a steady growth of about 6.8<br />
percent from 1980 to 2000. The number of jobs per household has also remained about the same<br />
at 1.35. Employment in <strong>St</strong>. <strong>Charles</strong> <strong>County</strong>, however, like its population, has grown dramatically