St. Charles County Transportation Plan 2030 - East-West Gateway ...
St. Charles County Transportation Plan 2030 - East-West Gateway ...
St. Charles County Transportation Plan 2030 - East-West Gateway ...

You also want an ePaper? Increase the reach of your titles
YUMPU automatically turns print PDFs into web optimized ePapers that Google loves.
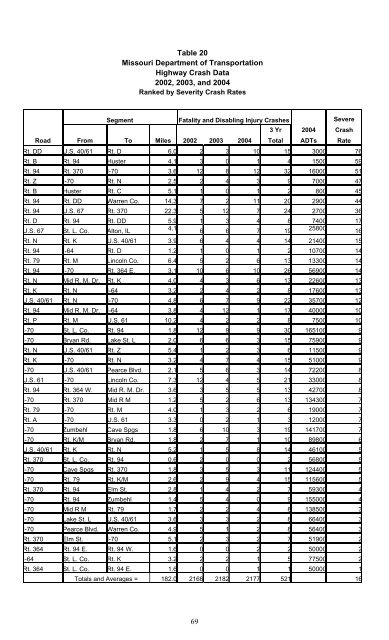
Table 20<br />
Missouri Department of <strong>Transportation</strong><br />
Highway Crash Data<br />
2002, 2003, and 2004<br />
Ranked by Severity Crash Rates<br />
Segment Fatality and Disabling Injury Crashes<br />
Severe<br />
3 Yr 2004 Crash<br />
Road From To Miles 2002 2003 2004 Total ADTs Rate<br />
Rt. DD U.S. 40/61 Rt. D 6.0 2 3 10 15 3000 76<br />
Rt. B Rt. 94 Huster 4.1 3 0 1 4 1500 59<br />
Rt. 94 Rt. 370 I-70 3.6 12 8 12 32 16000 51<br />
Rt. Z I-70 Rt. N 2.5 2 4 3 9 7000 47<br />
Rt. B Huster Rt. C 5.1 1 0 1 2 800 45<br />
Rt. 94 Rt. DD Warren Co. 14.3 7 2 11 20 2900 44<br />
Rt. 94 U.S. 67 Rt. 370 22.3 5 12 7 24 2700 36<br />
Rt. D Rt. 94 Rt. DD 5.9 1 3 4 8 7400 17<br />
U.S. 67 <strong>St</strong>. L. Co. Alton, IL<br />
4.1<br />
6 6 7 19<br />
25800<br />
16<br />
Rt. N Rt. K U.S. 40/61 3.9 6 4 4 14 21400 15<br />
Rt. 94 I-64 Rt. D 1.2 1 0 1 2 10700 14<br />
Rt. 79 Rt. M Lincoln Co. 6.4 5 2 6 13 13300 14<br />
Rt. 94 I-70 Rt. 364 E. 3.1 10 6 10 26 56900 14<br />
Rt. N Mid R. M. Dr. Rt. K 4.0 4 3 6 13 22600 13<br />
Rt. K Rt. N I-64 3.2 2 4 2 8 17600 13<br />
U.S. 40/61 Rt. N I-70 4.8 6 7 9 22 35700 12<br />
Rt. 94 Mid R. M. Dr. I-64 3.8 4 12 1 17 40000 10<br />
Rt. P Rt. M U.S. 61 10.2 4 2 2 8 7500 10<br />
I-70 <strong>St</strong>. L. Co. Rt. 94 1.8 12 9 9 30 165100 9<br />
I-70 Bryan Rd. Lake <strong>St</strong>. L 2.0 6 6 3 15 75900 9<br />
Rt. N U.S. 40/61 Rt. Z 5.4 1 2 3 6 11500 9<br />
Rt. K I-70 Rt. N 3.2 4 7 4 15 51000 9<br />
I-70 U.S. 40/61 Pearce Blvd. 2.1 5 6 3 14 72200 8<br />
U.S. 61 I-70 Lincoln Co. 7.3 12 4 5 21 33000 8<br />
Rt. 94 Rt. 364 W. Mid R. M. Dr. 3.6 3 5 5 13 42700 8<br />
I-70 Rt. 370 Mid R M 1.2 5 2 6 13 134300 7<br />
Rt. 79 I-70 Rt. M 4.0 1 3 2 6 19000 7<br />
Rt. A I-70 U.S. 61 3.3 0 2 1 3 12000 7<br />
I-70 Zumbehl Cave Spgs 1.8 6 10 3 19 141700 7<br />
I-70 Rt. K/M Bryan Rd. 1.8 2 7 1 10 89800 6<br />
U.S. 40/61 Rt. K Rt. N 5.2 1 5 8 14 46100 5<br />
Rt. 370 <strong>St</strong>. L. Co. Rt. 94 0.6 2 0 0 2 56800 5<br />
I-70 Cave Spgs Rt. 370 1.8 3 5 3 11 124400 5<br />
I-70 Rt. 79 Rt. K/M 2.6 2 9 4 15 115600 5<br />
Rt. 370 Rt. 94 Elm <strong>St</strong>. 2.8 1 4 2 7 59300 4<br />
I-70 Rt. 94 Zumbehl 1.4 5 4 0 9 155000 4<br />
I-70 Mid R M Rt. 79 1.7 2 2 4 8 138500 3<br />
I-70 Lake <strong>St</strong>. L U.S. 40/61 3.6 3 3 2 8 66400 3<br />
I-70 Pearce Blvd. Warren Co. 4.9 5 1 2 8 56400 3<br />
Rt. 370 Elm <strong>St</strong>. I-70 5.1 2 3 2 7 51900 2<br />
Rt. 364 Rt. 94 E. Rt. 94 W. 1.6 0 0 2 2 50000 2<br />
I-64 <strong>St</strong>. L. Co. Rt. K 3.2 2 2 1 5 77500 2<br />
Rt. 364 <strong>St</strong>. L. Co. Rt. 94 E. 1.6 0 0 1 1 50000 1<br />
Totals and Averages = 182.0 2168 2182 2177 521 16<br />
69