St. Charles County Transportation Plan 2030 - East-West Gateway ...
St. Charles County Transportation Plan 2030 - East-West Gateway ...
St. Charles County Transportation Plan 2030 - East-West Gateway ...

Create successful ePaper yourself
Turn your PDF publications into a flip-book with our unique Google optimized e-Paper software.
Criteria<br />
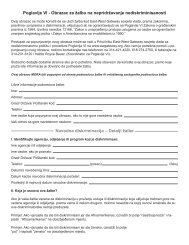
Table 10<br />
Level of Service Criteria<br />
For Freeway Segments<br />
37<br />
LOS<br />
A B C D E<br />
Free Flow Speed = 70 miles per hour<br />
Maximum density (pc/mi/ln) 11 18 26 35 45<br />
Minimum speed (mi/h) 70 70 70 70 70<br />
Maximum v/c 0.32 0.53 0.74 0.9 1<br />
Maximum hourly volume<br />
(pcphpl)<br />
770 1260 1770 2150 2400<br />
Free Flow Speed = 65 miles per hour<br />
Maximum density (pc/mi/ln) 11 18 26 35 45<br />
Minimum speed (mi/h) 65 65 64.8 59.7 52.2<br />
Maximum v/c 0.3 0.5 0.71 0.89 1<br />
Maximum hourly volume<br />
(pcphpl)<br />
710 1170 1680 2090 2350<br />
Free Flow Speed = 60 miles per hour<br />
Maximum density (pc/mi/ln) 11 18 26 35 45<br />
Minimum speed (mi/h) 60 60 60 57.6 51.1<br />
Maximum v/c 0.29 0.47 0.68 0.88 1<br />
Maximum hourly volume<br />
(pcphpl)<br />
660 1080 1560 2020 2300<br />
NOTE:<br />
The exact mathematical relationship between density and v/c has not always been maintained at<br />
LOS boundaries because of the use of rounded values. Density is the primary determinant of LOS.<br />
The speed criterion is the speed at maximum density for a given LOS.<br />
volumes were determined by applying a factor to the ADTs on Table 4 and by reviewing some of<br />
the volume count data from MoDOT. Conversion factors were applied to these numbers to take into<br />
account road widths, truck percent, terrain, and traffic fluctuations during the peak hours to get<br />
pcphpl as prescribed in the HCM 2000. From these adjusted peak hour volumes, the LOS for each<br />
direction of travel were calculated.