St. Charles County Transportation Plan 2030 - East-West Gateway ...
St. Charles County Transportation Plan 2030 - East-West Gateway ...
St. Charles County Transportation Plan 2030 - East-West Gateway ...
Create successful ePaper yourself
Turn your PDF publications into a flip-book with our unique Google optimized e-Paper software.
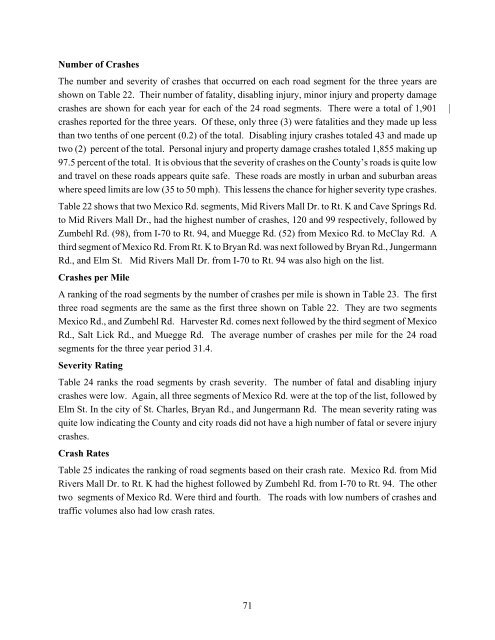
Number of Crashes<br />
The number and severity of crashes that occurred on each road segment for the three years are<br />
shown on Table 22. Their number of fatality, disabling injury, minor injury and property damage<br />
crashes are shown for each year for each of the 24 road segments. There were a total of 1,901 |<br />
crashes reported for the three years. Of these, only three (3) were fatalities and they made up less<br />
than two tenths of one percent (0.2) of the total. Disabling injury crashes totaled 43 and made up<br />
two (2) percent of the total. Personal injury and property damage crashes totaled 1,855 making up<br />
97.5 percent of the total. It is obvious that the severity of crashes on the <strong>County</strong>’s roads is quite low<br />
and travel on these roads appears quite safe. These roads are mostly in urban and suburban areas<br />
where speed limits are low (35 to 50 mph). This lessens the chance for higher severity type crashes.<br />
Table 22 shows that two Mexico Rd. segments, Mid Rivers Mall Dr. to Rt. K and Cave Springs Rd.<br />
to Mid Rivers Mall Dr., had the highest number of crashes, 120 and 99 respectively, followed by<br />
Zumbehl Rd. (98), from I-70 to Rt. 94, and Muegge Rd. (52) from Mexico Rd. to McClay Rd. A<br />
third segment of Mexico Rd. From Rt. K to Bryan Rd. was next followed by Bryan Rd., Jungermann<br />
Rd., and Elm <strong>St</strong>. Mid Rivers Mall Dr. from I-70 to Rt. 94 was also high on the list.<br />
Crashes per Mile<br />
A ranking of the road segments by the number of crashes per mile is shown in Table 23. The first<br />
three road segments are the same as the first three shown on Table 22. They are two segments<br />
Mexico Rd., and Zumbehl Rd. Harvester Rd. comes next followed by the third segment of Mexico<br />
Rd., Salt Lick Rd., and Muegge Rd. The average number of crashes per mile for the 24 road<br />
segments for the three year period 31.4.<br />
Severity Rating<br />
Table 24 ranks the road segments by crash severity. The number of fatal and disabling injury<br />
crashes were low. Again, all three segments of Mexico Rd. were at the top of the list, followed by<br />
Elm <strong>St</strong>. In the city of <strong>St</strong>. <strong>Charles</strong>, Bryan Rd., and Jungermann Rd. The mean severity rating was<br />
quite low indicating the <strong>County</strong> and city roads did not have a high number of fatal or severe injury<br />
crashes.<br />
Crash Rates<br />
Table 25 indicates the ranking of road segments based on their crash rate. Mexico Rd. from Mid<br />
Rivers Mall Dr. to Rt. K had the highest followed by Zumbehl Rd. from I-70 to Rt. 94. The other<br />
two segments of Mexico Rd. Were third and fourth. The roads with low numbers of crashes and<br />
traffic volumes also had low crash rates.<br />
71


