St. Charles County Transportation Plan 2030 - East-West Gateway ...
St. Charles County Transportation Plan 2030 - East-West Gateway ...
St. Charles County Transportation Plan 2030 - East-West Gateway ...

Create successful ePaper yourself
Turn your PDF publications into a flip-book with our unique Google optimized e-Paper software.
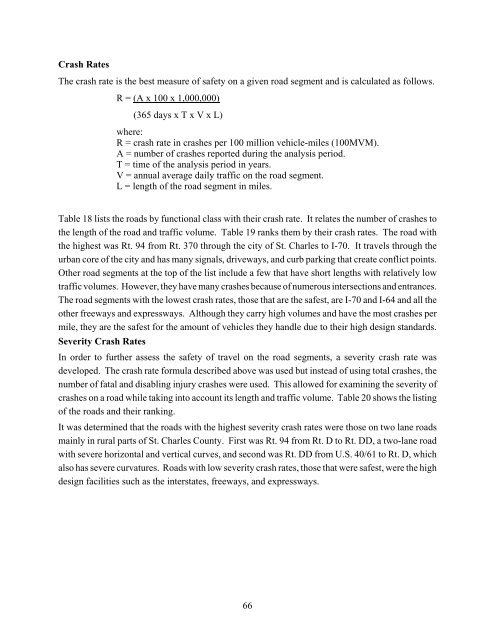
Crash Rates<br />
The crash rate is the best measure of safety on a given road segment and is calculated as follows.<br />
R = (A x 100 x 1,000,000)<br />
(365 days x T x V x L)<br />
where:<br />
R = crash rate in crashes per 100 million vehicle-miles (100MVM).<br />
A = number of crashes reported during the analysis period.<br />
T = time of the analysis period in years.<br />
V = annual average daily traffic on the road segment.<br />
L = length of the road segment in miles.<br />
Table 18 lists the roads by functional class with their crash rate. It relates the number of crashes to<br />
the length of the road and traffic volume. Table 19 ranks them by their crash rates. The road with<br />
the highest was Rt. 94 from Rt. 370 through the city of <strong>St</strong>. <strong>Charles</strong> to I-70. It travels through the<br />
urban core of the city and has many signals, driveways, and curb parking that create conflict points.<br />
Other road segments at the top of the list include a few that have short lengths with relatively low<br />
traffic volumes. However, they have many crashes because of numerous intersections and entrances.<br />
The road segments with the lowest crash rates, those that are the safest, are I-70 and I-64 and all the<br />
other freeways and expressways. Although they carry high volumes and have the most crashes per<br />
mile, they are the safest for the amount of vehicles they handle due to their high design standards.<br />
Severity Crash Rates<br />
In order to further assess the safety of travel on the road segments, a severity crash rate was<br />
developed. The crash rate formula described above was used but instead of using total crashes, the<br />
number of fatal and disabling injury crashes were used. This allowed for examining the severity of<br />
crashes on a road while taking into account its length and traffic volume. Table 20 shows the listing<br />
of the roads and their ranking.<br />
It was determined that the roads with the highest severity crash rates were those on two lane roads<br />
mainly in rural parts of <strong>St</strong>. <strong>Charles</strong> <strong>County</strong>. First was Rt. 94 from Rt. D to Rt. DD, a two-lane road<br />
with severe horizontal and vertical curves, and second was Rt. DD from U.S. 40/61 to Rt. D, which<br />
also has severe curvatures. Roads with low severity crash rates, those that were safest, were the high<br />
design facilities such as the interstates, freeways, and expressways.<br />
66