St. Charles County Transportation Plan 2030 - East-West Gateway ...
St. Charles County Transportation Plan 2030 - East-West Gateway ...
St. Charles County Transportation Plan 2030 - East-West Gateway ...

Create successful ePaper yourself
Turn your PDF publications into a flip-book with our unique Google optimized e-Paper software.
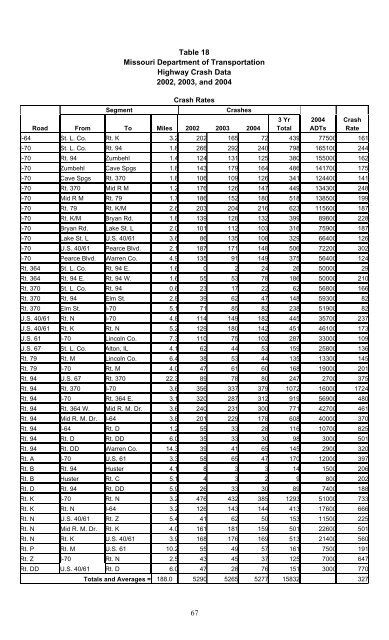
Table 18<br />
Missouri Department of <strong>Transportation</strong><br />
Highway Crash Data<br />
2002, 2003, and 2004<br />
Crash Rates<br />
Segment Crashes<br />
3 Yr 2004 Crash<br />
Road From To Miles 2002 2003 2004 Total ADTs Rate<br />
I-64 <strong>St</strong>. L. Co. Rt. K 3.2 202 165 72 439 77500 161<br />
I-70 <strong>St</strong>. L. Co. Rt. 94 1.8 266 292 240 798 165100 244<br />
I-70 Rt. 94 Zumbehl 1.4 124 131 125 380 155000 162<br />
I-70 Zumbehl Cave Spgs 1.8 143 179 164 486 141700 175<br />
I-70 Cave Spgs Rt. 370 1.8 106 109 126 341 124400 141<br />
I-70 Rt. 370 Mid R M 1.2 176 126 147 449 134300 248<br />
I-70 Mid R M Rt. 79 1.7 186 152 180 518 138500 199<br />
I-70 Rt. 79 Rt. K/M 2.6 203 204 216 623 115600 187<br />
I-70 Rt. K/M Bryan Rd. 1.8 139 128 132 399 89800 228<br />
I-70 Bryan Rd. Lake <strong>St</strong>. L 2.0 101 112 103 316 75900 187<br />
I-70 Lake <strong>St</strong>. L U.S. 40/61 3.6 86 135 108 329 66400 126<br />
I-70 U.S. 40/61 Pearce Blvd. 2.1 187 171 148 506 72200 302<br />
I-70 Pearce Blvd. Warren Co. 4.9 135 91 149 375 56400 124<br />
Rt. 364 <strong>St</strong>. L. Co. Rt. 94 E. 1.6 0 2 24 26 50000 29<br />
Rt. 364 Rt. 94 E. Rt. 94 W. 1.6 55 53 78 186 50000 210<br />
Rt. 370 <strong>St</strong>. L. Co. Rt. 94 0.6 23 17 22 62 56800 166<br />
Rt. 370 Rt. 94 Elm <strong>St</strong>. 2.8 39 62 47 148 59300 82<br />
Rt. 370 Elm <strong>St</strong>. I-70 5.1 71 85 82 238 51900 82<br />
U.S. 40/61 Rt. N I-70 4.8 114 149 182 445 35700 237<br />
U.S. 40/61 Rt. K Rt. N 5.2 129 180 142 451 46100 173<br />
U.S. 61 I-70 Lincoln Co. 7.3 110 75 102 287 33000 109<br />
U.S. 67 <strong>St</strong>. L. Co. Alton, IL 4.1 62 44 53 159 25800 136<br />
Rt. 79 Rt. M Lincoln Co. 6.4 38 53 44 135 13300 145<br />
Rt. 79 I-70 Rt. M 4.0 47 61 60 168 19000 201<br />
Rt. 94 U.S. 67 Rt. 370 22.3 89 78 80 247 2700 375<br />
Rt. 94 Rt. 370 I-70 3.6 356 337 379 1072 16000 1724<br />
Rt. 94 I-70 Rt. 364 E. 3.1 320 287 312 919 56900 480<br />
Rt. 94 Rt. 364 W. Mid R. M. Dr. 3.6 240 231 300 771 42700 461<br />
Rt. 94 Mid R. M. Dr. I-64 3.8 201 229 178 608 40000 370<br />
Rt. 94 I-64 Rt. D 1.2 55 33 28 116 10700 825<br />
Rt. 94 Rt. D Rt. DD 6.0 35 33 30 98 3000 501<br />
Rt. 94 Rt. DD Warren Co. 14.3 39 41 65 145 2900 320<br />
Rt. A I-70 U.S. 61 3.3 58 65 47 170 12000 397<br />
Rt. B Rt. 94 Huster 4.1 8 3 3 14 1500 206<br />
Rt. B Huster Rt. C 5.1 4 3 2 9 800 202<br />
Rt. D Rt. 94 Rt. DD 5.9 26 33 30 89 7400 188<br />
Rt. K I-70 Rt. N 3.2 476 432 385 1293 51000 733<br />
Rt. K Rt. N I-64 3.2 126 143 144 413 17600 666<br />
Rt. N U.S. 40/61 Rt. Z 5.4 41 62 50 153 11500 225<br />
Rt. N Mid R. M. Dr. Rt. K 4.0 161 181 159 501 22600 501<br />
Rt. N Rt. K U.S. 40/61 3.9 168 176 169 513 21400 560<br />
Rt. P Rt. M U.S. 61 10.2 55 49 57 161 7500 191<br />
Rt. Z I-70 Rt. N 2.5 43 45 37 125 7000 647<br />
Rt. DD U.S. 40/61 Rt. D 6.0 47 28 76 151 3000 770<br />
Totals and Averages = 188.0 5290 5265 5277 15832 327<br />
67