St. Charles County Transportation Plan 2030 - East-West Gateway ...
St. Charles County Transportation Plan 2030 - East-West Gateway ...
St. Charles County Transportation Plan 2030 - East-West Gateway ...

Create successful ePaper yourself
Turn your PDF publications into a flip-book with our unique Google optimized e-Paper software.
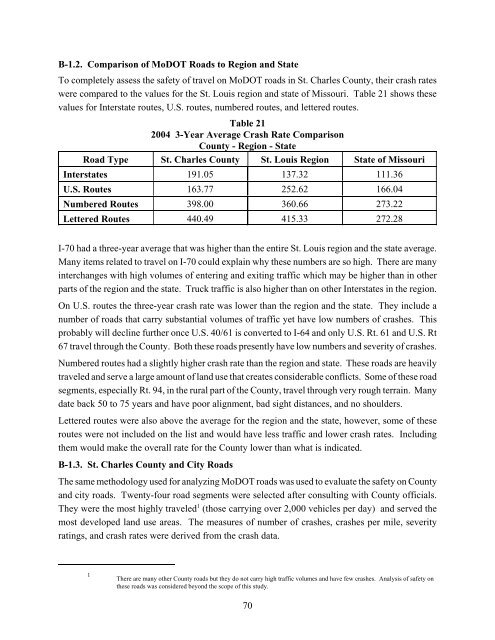
B-1.2. Comparison of MoDOT Roads to Region and <strong>St</strong>ate<br />
To completely assess the safety of travel on MoDOT roads in <strong>St</strong>. <strong>Charles</strong> <strong>County</strong>, their crash rates<br />
were compared to the values for the <strong>St</strong>. Louis region and state of Missouri. Table 21 shows these<br />
values for Interstate routes, U.S. routes, numbered routes, and lettered routes.<br />
Table 21<br />
2004 3-Year Average Crash Rate Comparison<br />
<strong>County</strong> - Region - <strong>St</strong>ate<br />
Road Type <strong>St</strong>. <strong>Charles</strong> <strong>County</strong> <strong>St</strong>. Louis Region <strong>St</strong>ate of Missouri<br />
Interstates 191.05 137.32 111.36<br />
U.S. Routes 163.77 252.62 166.04<br />
Numbered Routes 398.00 360.66 273.22<br />
Lettered Routes 440.49 415.33 272.28<br />
I-70 had a three-year average that was higher than the entire <strong>St</strong>. Louis region and the state average.<br />
Many items related to travel on I-70 could explain why these numbers are so high. There are many<br />
interchanges with high volumes of entering and exiting traffic which may be higher than in other<br />
parts of the region and the state. Truck traffic is also higher than on other Interstates in the region.<br />
On U.S. routes the three-year crash rate was lower than the region and the state. They include a<br />
number of roads that carry substantial volumes of traffic yet have low numbers of crashes. This<br />
probably will decline further once U.S. 40/61 is converted to I-64 and only U.S. Rt. 61 and U.S. Rt<br />
67 travel through the <strong>County</strong>. Both these roads presently have low numbers and severity of crashes.<br />
Numbered routes had a slightly higher crash rate than the region and state. These roads are heavily<br />
traveled and serve a large amount of land use that creates considerable conflicts. Some of these road<br />
segments, especially Rt. 94, in the rural part of the <strong>County</strong>, travel through very rough terrain. Many<br />
date back 50 to 75 years and have poor alignment, bad sight distances, and no shoulders.<br />
Lettered routes were also above the average for the region and the state, however, some of these<br />
routes were not included on the list and would have less traffic and lower crash rates. Including<br />
them would make the overall rate for the <strong>County</strong> lower than what is indicated.<br />
B-1.3. <strong>St</strong>. <strong>Charles</strong> <strong>County</strong> and City Roads<br />
The same methodology used for analyzing MoDOT roads was used to evaluate the safety on <strong>County</strong><br />
and city roads. Twenty-four road segments were selected after consulting with <strong>County</strong> officials.<br />
They were the most highly traveled 1 (those carrying over 2,000 vehicles per day) and served the<br />
most developed land use areas. The measures of number of crashes, crashes per mile, severity<br />
ratings, and crash rates were derived from the crash data.<br />
1<br />
There are many other <strong>County</strong> roads but they do not carry high traffic volumes and have few crashes. Analysis of safety on<br />
these roads was considered beyond the scope of this study.<br />
70