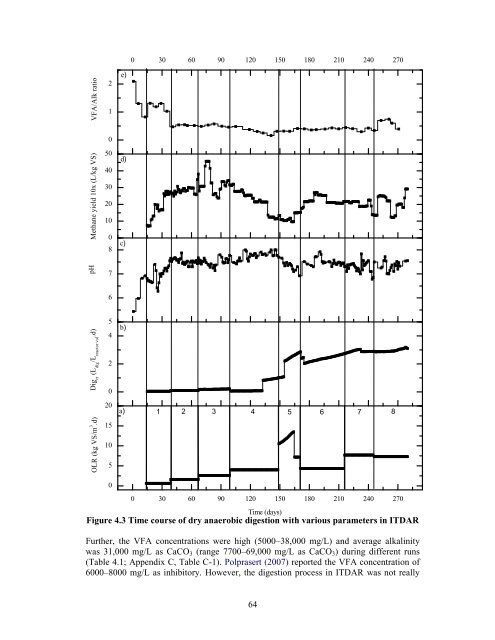
Dig rr (L dig /L reactor vol .d) pH Methane yield 10x (L/kg VS) VFA/Alk ratio OLR (kg VS/m 3 .d) 2 1 0 50 40 30 20 10 0 8 7 6 5 4 2 0 20 15 10 5 0 e) d) c) b) a) 0 30 60 90 120 150 180 210 240 270 1 2 3 4 5 6 7 8 0 30 60 90 120 150 180 210 240 270 Time (days) Figure 4.3 Time course <strong>of</strong> <strong>dry</strong> <strong>anaerobic</strong> <strong>digestion</strong> with various parameters in ITDAR Further, the VFA concentrations were high (5000 –38,000 mg/L) <strong>and</strong> average alkalinity was 31,000 mg/L as CaCO3 (range 7700–69,000 mg/L as CaCO3) during different runs (Table 4.1; Appendix C, Table C-1). Polprasert (2007) reported the VFA concentration <strong>of</strong> 6000–8000 mg/L as inhibitory. However, the <strong>digestion</strong> process in ITDAR was not really 64
getting affected with the presence <strong>of</strong> VFA concentrations higher than that <strong>of</strong> inhibitory levels. The reason is that VFA to alkalinity (VFA/Alk) ratio (a good indicator <strong>of</strong> digester failure) during various runs found to be in the range <strong>of</strong> 0.31–0.56 (Figure 4.3e), except for run 1 (1.21). Therefore, the methane yield for the run 1 was comparatively lower than the successive runs <strong>and</strong> correlated with the previous report by Khanal (2008) . He stated the VFA/Alk ratio <strong>of</strong> ≤ 0.4 <strong>and</strong> 0.8 for successful <strong>and</strong> faultier reactor functioning, respectively. The average concentration <strong>of</strong> 2325 mg/L ammonia-N was recorded in extracted liquid <strong>of</strong> <strong>digestate</strong> in ITDAR. High ammonia-N concentration has also been reported to act as buffer against the acidification effect <strong>of</strong> VFA (Lahav <strong>and</strong> Morgan, 2004). The detailed data <strong>of</strong> all these operational parameters has been given in Appendix C, Table C-1. From overall study, a maximum specific methane yield <strong>of</strong> 327 L/kg VSadded <strong>and</strong> minimum <strong>of</strong> 121 L/kg VSadded was recorded from runs 3 <strong>and</strong> 5, respectively (Appendix C, Table C- 2). The possible reasons could be that the lower OLR with higher SRT <strong>and</strong> higher OLR with lower SRT, respectively, for run 3 <strong>and</strong> 5. Further, the higher Digrr <strong>and</strong> sudden overloading <strong>of</strong> reactor <strong>and</strong> consequent drop in pH could also be the possible reasons for the lower methane yield during run 5 ( Figure 4.3b). The specific methane yield for the centralized DRANCO system was reported to be in the range <strong>of</strong> 210 to 300 L/kgVSadded (De Gioannis et al., 2008). The present study results, in terms <strong>of</strong> specific methane yield, were in line with the performance <strong>of</strong> centralized units. But, on the other h<strong>and</strong> ITDAR can uphold the overall net energy gain by reducing the collection <strong>and</strong> transportation costs found to be advantageous for using it in decentralized level. Further, the underst<strong>and</strong>ing <strong>of</strong> relationship between the pH, ammonia-N <strong>and</strong> VFA accumulation with the different feedstock characteristics was considered as important to improve the reactor performance. Hence, the following sections primarily emphasized the relationship between feedstock characteristics, ammonia-N accumulation <strong>and</strong> VFA interactions in ITDAR (Figure 4.4, Note: VFA data for Day 1-120 has not been included to clearly show the probable interaction, however, this data is provided in Table C-1 <strong>of</strong> Appendix C <strong>and</strong> in Table 4.1). 4.2.2 Effect <strong>of</strong> C/N ratio <strong>and</strong> ammonia-N accumulation in ITDAR Table 4.1 <strong>and</strong> Figure 4.4(a–e) depict the important parameters <strong>of</strong> <strong>digestion</strong> viz., pH, VFA, VFA/Alk ratio, ammonia-N, free ammonia, methane yield <strong>and</strong> VS removal (Appendix C, Table C-1 <strong>and</strong> Table C-2), which can directly affect the performance <strong>of</strong> the ITDAR. a) Effect <strong>of</strong> feedstock 1 (C/N ratio <strong>of</strong> 27) in ITDAR – Run 1 to 3 Feedstock 1 with the C/N ratio <strong>of</strong> 27 was used in the start-up <strong>of</strong> ITDAR <strong>and</strong> in runs 1–3. The maximum concentration <strong>of</strong> 3200 mg/L <strong>of</strong> ammonia-N concentration was recorded during run 1. Later, the average concentrations subsequently reduced up to 3040 mg/L <strong>and</strong> 2671 mg/L in run 2 <strong>and</strong> 3, respectively. The pH was lower during run 1 <strong>and</strong> increased to near neutral range during run 2 <strong>and</strong> 3. Therefore, the escape <strong>of</strong> ammonia-N as gas during run 1 was comparatively lesser than the other two runs as noticed from the free ammonia concentration levels. As stated, the average concentration <strong>of</strong> free ammonia was 99 mg/L in run 1, whereas it was around 328 <strong>and</strong> 284 mg/L during run 2 <strong>and</strong> 3, respectively. It was reported that the free ammonia can severely affect the <strong>anaerobic</strong> system under concentrations <strong>of</strong> 200–700 mg/L in thermophilic <strong>anaerobic</strong> systems by various authors (Hansen et al., 1998; Straka et al., 2007; Nakakubo et al., 2008; El-Hadj et al., 2009; Yabu 65
- Page 1 and 2:
DRY ANAEROBIC DIGESTION OF MUNICIPA
- Page 3 and 4:
Abstract Global solid waste generat
- Page 5 and 6:
2.9 Characteristics of Digestates 3
- Page 7 and 8:
List of Tables Table Title Page 2.1
- Page 9 and 10:
4.20 Layout of conceptual decentral
- Page 11 and 12:
1.1 Background Chapter 1 Introducti
- Page 13 and 14:
The specific objectives of this res
- Page 15 and 16:
scale plants of the two processes i
- Page 17 and 18:
acetogens play their part to run th
- Page 19 and 20:
In dry anaerobic digestion, recycli
- Page 21 and 22:
process is inhibited and at that po
- Page 23 and 24: eported, which increased with time,
- Page 25 and 26: acids and increased downfall of pat
- Page 27 and 28: performance of a poorly mixed (1 rp
- Page 29 and 30: conventional low-solid system at th
- Page 31 and 32: supply of the nutrients missing in
- Page 33 and 34: 2.6.2 Single-stage continuous syste
- Page 35 and 36: single stage systems are DRANCO, Va
- Page 37 and 38: of the solid content around 23% TS
- Page 39 and 40: Substrate Feed TS (%) Reactor Type
- Page 41 and 42: Second is that it has a high water
- Page 43 and 44: 2.9 Characteristics of Digestates D
- Page 45 and 46: For instance, Mumme et al., (2010)
- Page 47 and 48: Comparison of liquid and solid dige
- Page 49 and 50: 2.10 Management Aspects of Anaerobi
- Page 51 and 52: Figure 2.11 Changing parameters dur
- Page 53 and 54: amount of anaerobic fermentation re
- Page 55 and 56: 3.1 Inoculum and Simulations of Was
- Page 57 and 58: ed pump, water circulating jacket,
- Page 59 and 60: the reactor was increased from 35°
- Page 61 and 62: parts (wt/wt bas is) of digestate c
- Page 63 and 64: Sand drying bed (SDB) is simple, ea
- Page 65 and 66: 3.4.4 Estimation of GHG emissions i
- Page 67 and 68: d) Calculation methods i) CH4 emiss
- Page 69 and 70: Table 3.5 Analytical Methods for Va
- Page 71 and 72: Biogas production 100X (NmL) Specif
- Page 73: (i.e. 5.2 and 3.04 respectively, pl
- Page 77 and 78: feedstock 2 is considered as a sudd
- Page 79 and 80: 8.0) at most of the above said time
- Page 81 and 82: Table 4.2 Surplus Energy of ITDAR D
- Page 83 and 84: VFA 100 X (mg/L) VFA/Alk ratio 200
- Page 85 and 86: the VFA concentration increased to
- Page 87 and 88: The increase in GPR was almost line
- Page 89 and 90: Based on our results, the best oper
- Page 91 and 92: Based on this property of digestate
- Page 93 and 94: Table 4.5. With curing of digestate
- Page 95 and 96: application (after curing) in CH 4
- Page 97 and 98: digestion, etc. Moreover, mixing of
- Page 99 and 100: Figure 4.20 Layout of conceptual de
- Page 101 and 102: Chapter 5 Conclusions and Recommend
- Page 103 and 104: 5.2 Recommendations Following are t
- Page 105 and 106: References Abdullahi, Y. A., Akunna
- Page 107 and 108: Cengel, Y.A. (2003). Heat Transfer
- Page 109 and 110: Forster-Carneiro, T., Pérez, M., R
- Page 111 and 112: Kaparaju, P., Buendia, I., Ellegaar
- Page 113 and 114: Liu, C., Yuan, X., Zeng, G., Li, W.
- Page 115 and 116: Paavola, T. and Rintala, J. (2008).
- Page 117 and 118: Stroot, P. G., McMahon, K. D., Mack
- Page 119 and 120: Zeshan, Karthikeyan, O. P. and Visv
- Page 121 and 122: Fruit and vegetable Waste Closer to
- Page 123 and 124: Figure A-5 Sand drying bed for dewa
- Page 125 and 126:
Assumptions Size of the community:
- Page 127 and 128:
The flow rate of 0.569 m 3 biogas/h
- Page 129 and 130:
Area for 910 kg dry solids = 910 (k
- Page 131 and 132:
= 280 m 3 /d x 0.000717 tons/m 3 (D
- Page 133 and 134:
Table C-1 Operational Parameters of
- Page 135 and 136:
Run Time GPR % CO2 % CH4 Methane Yi
- Page 137 and 138:
Appendix D Data of Phase II Pilot E
- Page 139 and 140:
Table D-3 Characteristics of Feed a
- Page 141 and 142:
Methodology Methodology for for Ene
- Page 143 and 144:
Q = Heat transfer rate or heat loss
- Page 145:
Calculation of GHG Emission Potenti