

dry anaerobic digestion of municipal solid waste and digestate ...
dry anaerobic digestion of municipal solid waste and digestate ...
dry anaerobic digestion of municipal solid waste and digestate ...

Create successful ePaper yourself
Turn your PDF publications into a flip-book with our unique Google optimized e-Paper software.
Table 4.5. With curing <strong>of</strong> <strong>digestate</strong>, the organic content (C <strong>and</strong> VS) decreased significantly<br />
(20.55%) <strong>and</strong> hence, C/N ratio <strong>of</strong> the <strong>digestate</strong> decreased to 17.52. This range <strong>of</strong> C/N ratio<br />
is good for an organic material to be applied on agricultural l<strong>and</strong> as soil amendment.<br />
4.4.3 Digestate management from perspectives <strong>of</strong> GHG emissions<br />
Data <strong>of</strong> <strong>digestate</strong> characteristics (Table 4. 5) was obtained by lab analysis <strong>of</strong> <strong>digestate</strong><br />
samples at each stage. Based on these data <strong>and</strong> the methods in section 3.4.4-d-(i), GHG<br />
emission potential <strong>of</strong> <strong>digestate</strong> was calculated at different stages <strong>of</strong> <strong>digestate</strong> management.<br />
Comparison <strong>of</strong> different <strong>digestate</strong> management options with regards to GHG emissions<br />
was then made possible. The results regarding this have been presented <strong>and</strong> discussed in<br />
this section.<br />
i) GHG emission potential <strong>of</strong> <strong>digestate</strong><br />
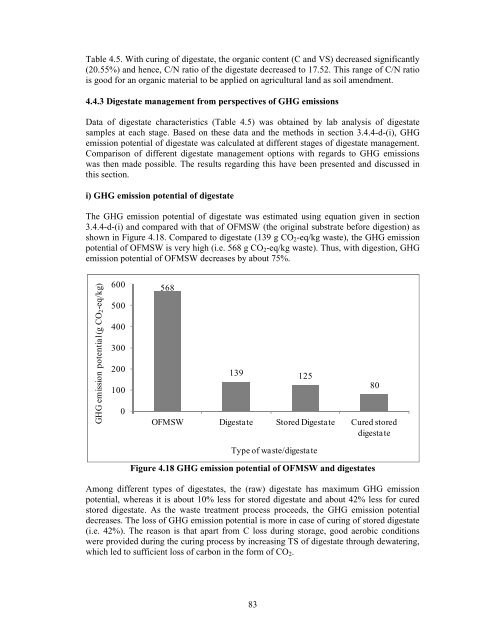
The GHG emission potential <strong>of</strong> <strong>digestate</strong> was estimated using equation given in section<br />
3.4.4-d-(i) <strong>and</strong> compared with that <strong>of</strong> OFMSW (the original substrate before <strong>digestion</strong>) as<br />
shown in Figure 4.18. Compared to <strong>digestate</strong> (139 g CO2-eq/kg <strong>waste</strong>), the GHG emission<br />
potential <strong>of</strong> OFMSW is very high (i.e. 568 g CO2-eq/kg <strong>waste</strong>). Thus, with <strong>digestion</strong>, GHG<br />
emission potential <strong>of</strong> OFMSW decreases by about 75%.<br />
GHG emission potential (g CO2-eq/kg)<br />
600<br />
500<br />
400<br />
300<br />
200<br />
100<br />
0<br />
568<br />
139 125<br />
OFMSW Digestate Stored Digestate Cured stored<br />
<strong>digestate</strong><br />
Type <strong>of</strong> <strong>waste</strong>/<strong>digestate</strong><br />
Figure 4.18 GHG emission potential <strong>of</strong> OFMSW <strong>and</strong> <strong>digestate</strong>s<br />
Among different types <strong>of</strong> <strong>digestate</strong>s, the (raw) <strong>digestate</strong> has maximum GHG emission<br />
potential, whereas it is about 10% less for stored <strong>digestate</strong> <strong>and</strong> about 42% less for cured<br />
stored <strong>digestate</strong>. As the <strong>waste</strong> treatment process proceeds, the GHG emission potential<br />
decreases. The loss <strong>of</strong> GHG emission potential is more in case <strong>of</strong> curing <strong>of</strong> stored <strong>digestate</strong><br />
(i.e. 42%). The reason is that apart from C loss during storage, good aerobic conditions<br />
were provided during the curing process by increasing TS <strong>of</strong> <strong>digestate</strong> through dewatering,<br />
which led to sufficient loss <strong>of</strong> carbon in the form <strong>of</strong> CO2.<br />
83<br />
80


