

dry anaerobic digestion of municipal solid waste and digestate ...
dry anaerobic digestion of municipal solid waste and digestate ...
dry anaerobic digestion of municipal solid waste and digestate ...

Create successful ePaper yourself
Turn your PDF publications into a flip-book with our unique Google optimized e-Paper software.
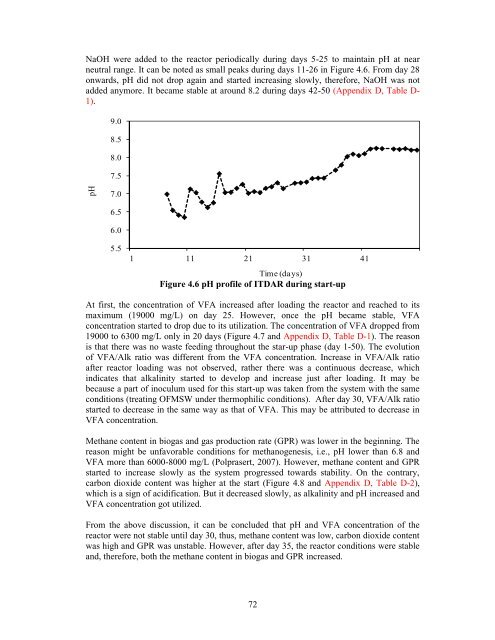
NaOH were added to the reactor periodically during days 5-25 to maintain pH at near<br />
neutral range. It can be noted as small peaks during days 11-26 in Figure 4.6. From day 28<br />
onwards, pH did not drop again <strong>and</strong> started increasing slowly, therefore, NaOH was not<br />
added anymore. It became stable at around 8.2 during days 42-50 (Appendix D, Table D-<br />
1).<br />
pH<br />
9.0<br />
8.5<br />
8.0<br />
7.5<br />
7.0<br />
6.5<br />
6.0<br />
5.5<br />
1 11 21 31 41<br />
Time (days)<br />
Figure 4.6 pH pr<strong>of</strong>ile <strong>of</strong> ITDAR during start-up<br />
At first, the concentration <strong>of</strong> VFA increased after loading the reactor <strong>and</strong> reached to its<br />
maximum (19000 mg/L) on day 25. However, once the pH became stable, VFA<br />
concentration started to drop due to its utilization. The concentration <strong>of</strong> VFA dropped from<br />
19000 to 6300 mg/L only in 20 days (Figure 4.7 <strong>and</strong> Appendix D, Table D-1). The reason<br />
is that there was no <strong>waste</strong> feeding throughout the star-up phase (day 1-50). The evolution<br />
<strong>of</strong> VFA/Alk ratio was different from the VFA concentration. Increase in VFA/Alk ratio<br />
after reactor loading was not observed, rather there was a continuous decrease, which<br />
indicates that alkalinity started to develop <strong>and</strong> increase just after loading. It may be<br />
because a part <strong>of</strong> inoculum used for this start-up was taken from the system with the same<br />
conditions (treating OFMSW under thermophilic conditions). After day 30, VFA/Alk ratio<br />
started to decrease in the same way as that <strong>of</strong> VFA. This may be attributed to decrease in<br />
VFA concentration.<br />
Methane content in biogas <strong>and</strong> gas production rate (GPR) was lower in the beginning. The<br />
reason might be unfavorable conditions for methanogenesis, i.e., pH lower than 6.8 <strong>and</strong><br />
VFA more than 6000-8000 mg/L (Polprasert, 2007). However, methane content <strong>and</strong> GPR<br />
started to increase slowly as the system progressed towards stability. On the contrary,<br />
carbon dioxide content was higher at the start (Figure 4.8 <strong>and</strong> Appendix D, Table D-2),<br />
which is a sign <strong>of</strong> acidification. But it decreased slowly, as alkalinity <strong>and</strong> pH increased <strong>and</strong><br />
VFA concentration got utilized.<br />
From the above discussion, it can be concluded that pH <strong>and</strong> VFA concentration <strong>of</strong> the<br />
reactor were not stable until day 30, thus, methane content was low, carbon dioxide content<br />
was high <strong>and</strong> GPR was unstable. However, after day 35, the reactor conditions were stable<br />
<strong>and</strong>, therefore, both the methane content in biogas <strong>and</strong> GPR increased.<br />
72


