Analysis of the Vehicle Inventory and Use Survey for Trucks ... - About
Analysis of the Vehicle Inventory and Use Survey for Trucks ... - About
Analysis of the Vehicle Inventory and Use Survey for Trucks ... - About
Create successful ePaper yourself
Turn your PDF publications into a flip-book with our unique Google optimized e-Paper software.
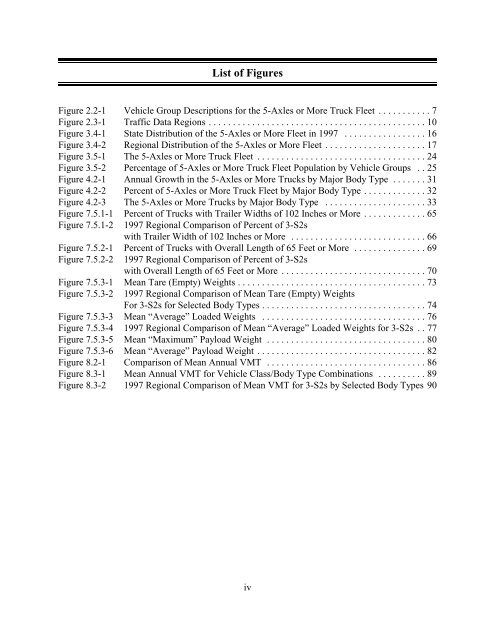
List <strong>of</strong> Figures<br />
Figure 2.2-1 <strong>Vehicle</strong> Group Descriptions <strong>for</strong> <strong>the</strong> 5-Axles or More Truck Fleet ...........7<br />
Figure 2.3-1 Traffic Data Regions .............................................10<br />
Figure 3.4-1 State Distribution <strong>of</strong> <strong>the</strong> 5-Axles or More Fleet in 1997 .................16<br />
Figure 3.4-2 Regional Distribution <strong>of</strong> <strong>the</strong> 5-Axles or More Fleet .....................17<br />
Figure 3.5-1 The 5-Axles or More Truck Fleet ...................................24<br />
Figure 3.5-2 Percentage <strong>of</strong> 5-Axles or More Truck Fleet Population by <strong>Vehicle</strong> Groups . . 25<br />
Figure 4.2-1 Annual Growth in <strong>the</strong> 5-Axles or More <strong>Trucks</strong> by Major Body Type .......31<br />
Figure 4.2-2 Percent <strong>of</strong> 5-Axles or More Truck Fleet by Major Body Type .............32<br />
Figure 4.2-3 The 5-Axles or More <strong>Trucks</strong> by Major Body Type .....................33<br />
Figure 7.5.1-1 Percent <strong>of</strong> <strong>Trucks</strong> with Trailer Widths <strong>of</strong> 102 Inches or More .............65<br />
Figure 7.5.1-2 1997 Regional Comparison <strong>of</strong> Percent <strong>of</strong> 3-S2s<br />
with Trailer Width <strong>of</strong> 102 Inches or More ............................66<br />
Figure 7.5.2-1 Percent <strong>of</strong> <strong>Trucks</strong> with Overall Length <strong>of</strong> 65 Feet or More ...............69<br />
Figure 7.5.2-2 1997 Regional Comparison <strong>of</strong> Percent <strong>of</strong> 3-S2s<br />
with Overall Length <strong>of</strong> 65 Feet or More ..............................70<br />
Figure 7.5.3-1 Mean Tare (Empty) Weights .......................................73<br />
Figure 7.5.3-2 1997 Regional Comparison <strong>of</strong> Mean Tare (Empty) Weights<br />
For 3-S2s <strong>for</strong> Selected Body Types..................................74<br />
Figure 7.5.3-3 Mean “Average” Loaded Weights ..................................76<br />
Figure 7.5.3-4 1997 Regional Comparison <strong>of</strong> Mean “Average” Loaded Weights <strong>for</strong> 3-S2s . . 77<br />
Figure 7.5.3-5 Mean “Maximum” Payload Weight .................................80<br />
Figure 7.5.3-6 Mean “Average” Payload Weight ...................................82<br />
Figure 8.2-1 Comparison <strong>of</strong> Mean Annual VMT .................................86<br />
Figure 8.3-1 Mean Annual VMT <strong>for</strong> <strong>Vehicle</strong> Class/Body Type Combinations ..........89<br />
Figure 8.3-2 1997 Regional Comparison <strong>of</strong> Mean VMT <strong>for</strong> 3-S2s by Selected Body Types 90<br />
iv


