

Analysis of the Vehicle Inventory and Use Survey for Trucks ... - About
Analysis of the Vehicle Inventory and Use Survey for Trucks ... - About
Analysis of the Vehicle Inventory and Use Survey for Trucks ... - About

Create successful ePaper yourself
Turn your PDF publications into a flip-book with our unique Google optimized e-Paper software.
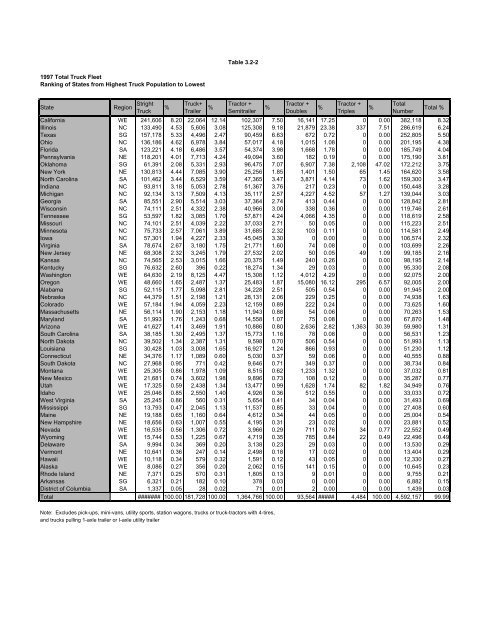
1997 Total Truck Fleet<br />
Ranking <strong>of</strong> States from Highest Truck Population to Lowest<br />
State Region Stright<br />
Truck<br />
%<br />
Truck+<br />
Trailer %<br />
Table 3.2-2<br />
Tractor +<br />
Semitrailer<br />
%<br />
Tractor +<br />
Doubles<br />
%<br />
Tractor +<br />
Triples<br />
%<br />
Total<br />
Number<br />
Cali<strong>for</strong>nia WE 241,606 8.20 22,064 12.14 102,307 7.50 16,141 17.25 0 0.00 382,118 8.32<br />
Illinois NC 133,490 4.53 5,606 3.08 125,308 9.18 21,879 23.38 337 7.51 286,619 6.24<br />
Texas SG 157,178 5.33 4,496 2.47 90,459 6.63 672 0.72 0 0.00 252,805 5.50<br />
Ohio NC 136,186 4.62 6,978 3.84 57,017 4.18 1,015 1.08 0 0.00 201,195 4.38<br />
Florida SA 123,221 4.18 6,486 3.57 54,374 3.98 1,668 1.78 0 0.00 185,749 4.04<br />
Pennsylvania NE 118,201 4.01 7,713 4.24 49,094 3.60 182 0.19 0 0.00 175,190 3.81<br />
Oklahoma SG 61,391 2.08 5,331 2.93 96,475 7.07 6,907 7.38 2,108 47.02 172,212 3.75<br />
New York NE 130,813 4.44 7,085 3.90 25,256 1.85 1,401 1.50 65 1.45 164,620 3.58<br />
North Carolina SA 101,462 3.44 6,529 3.59 47,365 3.47 3,871 4.14 73 1.62 159,300 3.47<br />
Indiana NC 93,811 3.18 5,053 2.78 51,367 3.76 217 0.23 0 0.00 150,448 3.28<br />
Michigan NC 92,134 3.13 7,509 4.13 35,117 2.57 4,227 4.52 57 1.27 139,044 3.03<br />
Georgia SA 85,551 2.90 5,514 3.03 37,364 2.74 413 0.44 0 0.00 128,842 2.81<br />
Wisconsin NC 74,111 2.51 4,332 2.38 40,966 3.00 338 0.36 0 0.00 119,746 2.61<br />
Tennessee SG 53,597 1.82 3,085 1.70 57,871 4.24 4,066 4.35 0 0.00 118,619 2.58<br />
Missouri NC 74,101 2.51 4,039 2.22 37,033 2.71 50 0.05 0 0.00 115,223 2.51<br />
Minnesota NC 75,733 2.57 7,061 3.89 31,685 2.32 103 0.11 0 0.00 114,581 2.49<br />
Iowa NC 57,301 1.94 4,227 2.33 45,045 3.30 0 0.00 0 0.00 106,574 2.32<br />
Virginia SA 78,674 2.67 3,180 1.75 21,771 1.60 74 0.08 0 0.00 103,699 2.26<br />
New Jersey NE 68,308 2.32 3,245 1.79 27,532 2.02 50 0.05 49 1.09 99,185 2.16<br />
Kansas NC 74,565 2.53 3,015 1.66 20,375 1.49 240 0.26 0 0.00 98,195 2.14<br />
Kentucky SG 76,632 2.60 396 0.22 18,274 1.34 29 0.03 0 0.00 95,330 2.08<br />
Washington WE 64,630 2.19 8,125 4.47 15,308 1.12 4,012 4.29 0 0.00 92,075 2.00<br />
Oregon WE 48,660 1.65 2,487 1.37 25,483 1.87 15,080 16.12 295 6.57 92,005 2.00<br />
Alabama SG 52,115 1.77 5,098 2.81 34,228 2.51 505 0.54 0 0.00 91,945 2.00<br />
Nebraska NC 44,379 1.51 2,198 1.21 28,131 2.06 229 0.25 0 0.00 74,938 1.63<br />
Colorado WE 57,184 1.94 4,059 2.23 12,159 0.89 222 0.24 0 0.00 73,625 1.60<br />
Massachusetts NE 56,114 1.90 2,153 1.18 11,943 0.88 54 0.06 0 0.00 70,263 1.53<br />
Maryl<strong>and</strong> SA 51,993 1.76 1,243 0.68 14,558 1.07 75 0.08 0 0.00 67,870 1.48<br />
Arizona WE 41,627 1.41 3,469 1.91 10,886 0.80 2,636 2.82 1,363 30.39 59,980 1.31<br />
South Carolina SA 38,185 1.30 2,495 1.37 15,773 1.16 78 0.08 0 0.00 56,531 1.23<br />
North Dakota NC 39,502 1.34 2,387 1.31 9,598 0.70 506 0.54 0 0.00 51,993 1.13<br />
Louisiana SG 30,428 1.03 3,008 1.65 16,927 1.24 866 0.93 0 0.00 51,230 1.12<br />
Connecticut NE 34,376 1.17 1,089 0.60 5,030 0.37 59 0.06 0 0.00 40,555 0.88<br />
South Dakota NC 27,968 0.95 771 0.42 9,646 0.71 349 0.37 0 0.00 38,734 0.84<br />
Montana WE 25,305 0.86 1,978 1.09 8,515 0.62 1,233 1.32 0 0.00 37,032 0.81<br />
New Mexico WE 21,681 0.74 3,602 1.98 9,896 0.73 108 0.12 0 0.00 35,287 0.77<br />
Utah WE 17,325 0.59 2,438 1.34 13,477 0.99 1,628 1.74 82 1.82 34,949 0.76<br />
Idaho WE 25,046 0.85 2,550 1.40 4,926 0.36 512 0.55 0 0.00 33,033 0.72<br />
West Virginia SA 25,245 0.86 560 0.31 5,654 0.41 34 0.04 0 0.00 31,493 0.69<br />
Mississippi SG 13,793 0.47 2,045 1.13 11,537 0.85 33 0.04 0 0.00 27,408 0.60<br />
Maine NE 19,188 0.65 1,160 0.64 4,612 0.34 44 0.05 0 0.00 25,004 0.54<br />
New Hampshire NE 18,656 0.63 1,007 0.55 4,195 0.31 23 0.02 0 0.00 23,881 0.52<br />
Nevada WE 16,535 0.56 1,306 0.72 3,966 0.29 711 0.76 34 0.77 22,552 0.49<br />
Wyoming WE 15,744 0.53 1,225 0.67 4,719 0.35 785 0.84 22 0.49 22,496 0.49<br />
Delaware SA 9,994 0.34 369 0.20 3,138 0.23 29 0.03 0 0.00 13,530 0.29<br />
Vermont NE 10,641 0.36 247 0.14 2,498 0.18 17 0.02 0 0.00 13,404 0.29<br />
Hawaii WE 10,118 0.34 579 0.32 1,591 0.12 43 0.05 0 0.00 12,330 0.27<br />
Alaska WE 8,086 0.27 356 0.20 2,062 0.15 141 0.15 0 0.00 10,645 0.23<br />
Rhode Isl<strong>and</strong> NE 7,371 0.25 570 0.31 1,805 0.13 9 0.01 0 0.00 9,755 0.21<br />
Arkansas SG 6,321 0.21 182 0.10 378 0.03 0 0.00 0 0.00 6,882 0.15<br />
District <strong>of</strong> Columbia SA 1,337 0.05 28 0.02 71 0.01 2 0.00 0 0.00 1,439 0.03<br />
Total ####### 100.00 181,728 100.00 1,364,766 100.00 93,564 ##### 4,484 100.00 4,592,157 99.99<br />
Note: Excludes pick-ups, mini-vans, utility sports, station wagons, trucks or truck-tractors with 4-tires,<br />
<strong>and</strong> trucks pulling 1-axle trailer or I-axle utility trailer<br />
Total %


