

Analysis of the Vehicle Inventory and Use Survey for Trucks ... - About
Analysis of the Vehicle Inventory and Use Survey for Trucks ... - About
Analysis of the Vehicle Inventory and Use Survey for Trucks ... - About

You also want an ePaper? Increase the reach of your titles
YUMPU automatically turns print PDFs into web optimized ePapers that Google loves.
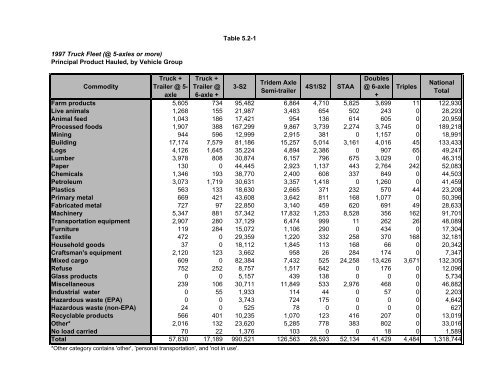
1997 Truck Fleet (@ 5-axles or more)<br />
Principal Product Hauled, by <strong>Vehicle</strong> Group<br />
Commodity<br />
Truck +<br />
Trailer @ 5axle<br />
Truck +<br />
Trailer @<br />
6-axle +<br />
Table 5.2-1<br />
3-S2<br />
Tridem Axle<br />
Semi-trailer<br />
4S1/S2 STAA<br />
Doubles<br />
@ 6-axle<br />
+<br />
Triples<br />
National<br />
Total<br />
Farm products 5,605 734 95,482 6,864 4,710 5,825 3,699 11 122,930<br />
Live animals 1,268 155 21,987 3,483 654 502 243 0 28,293<br />
Animal feed 1,043 186 17,421 954 136 614 605 0 20,959<br />
Processed foods 1,907 388 167,299 9,867 3,739 2,274 3,745 0 189,218<br />
Mining 944 596 12,999 2,915 381 0 1,157 0 18,991<br />
Building 17,174 7,579 81,186 15,257 5,014 3,161 4,016 45 133,433<br />
Logs 4,126 1,645 35,224 4,894 2,386 0 907 65 49,247<br />
Lumber 3,978 808 30,874 6,157 796 675 3,029 0 46,315<br />
Paper 130 0 44,445 2,923 1,137 443 2,764 242 52,083<br />
Chemicals 1,346 193 38,770 2,400 608 337 849 0 44,503<br />
Petroleum 3,073 1,719 30,631 3,357 1,418 0 1,260 0 41,459<br />
Plastics 563 133 18,630 2,665 371 232 570 44 23,208<br />
Primary metal 669 421 43,608 3,642 811 168 1,077 0 50,396<br />
Fabricated metal 727 97 22,850 3,140 459 620 691 49 28,633<br />
Machinery 5,347 881 57,342 17,832 1,253 8,528 356 162 91,701<br />
Transportation equipment 2,907 280 37,129 6,474 999 11 262 26 48,089<br />
Furniture 119 284 15,072 1,106 290 0 434 0 17,304<br />
Textile 472 0 29,359 1,220 332 258 370 168 32,181<br />
Household goods 37 0 18,112 1,845 113 168 66 0 20,342<br />
Craftsman's equipment 2,120 123 3,662 958 26 284 174 0 7,347<br />
Mixed cargo 609 0 82,384 7,432 525 24,258 13,426 3,671 132,305<br />
Refuse 752 252 8,757 1,517 642 0 176 0 12,096<br />
Glass products 0 0 5,157 439 138 0 0 0 5,734<br />
Miscellaneous 239 106 30,711 11,849 533 2,976 468 0 46,882<br />
Industrial water 0 55 1,933 114 44 0 57 0 2,203<br />
Hazardous waste (EPA) 0 0 3,743 724 175 0 0 0 4,642<br />
Hazardous waste (non-EPA) 24 0 525 78 0 0 0 0 627<br />
Recyclable products 566 401 10,235 1,070 123 416 207 0 13,019<br />
O<strong>the</strong>r* 2,016 132 23,620 5,285 778 383 802 0 33,016<br />
No load carried 70 22 1,376 103 0 0 18 0 1,589<br />
Total 57,830 17,189 990,521 126,563 28,593 52,134 41,429 4,484 1,318,744<br />
*O<strong>the</strong>r category contains 'o<strong>the</strong>r', 'personal transportation', <strong>and</strong> 'not in use'.


