Analysis of the Vehicle Inventory and Use Survey for Trucks ... - About
Analysis of the Vehicle Inventory and Use Survey for Trucks ... - About
Analysis of the Vehicle Inventory and Use Survey for Trucks ... - About
You also want an ePaper? Increase the reach of your titles
YUMPU automatically turns print PDFs into web optimized ePapers that Google loves.
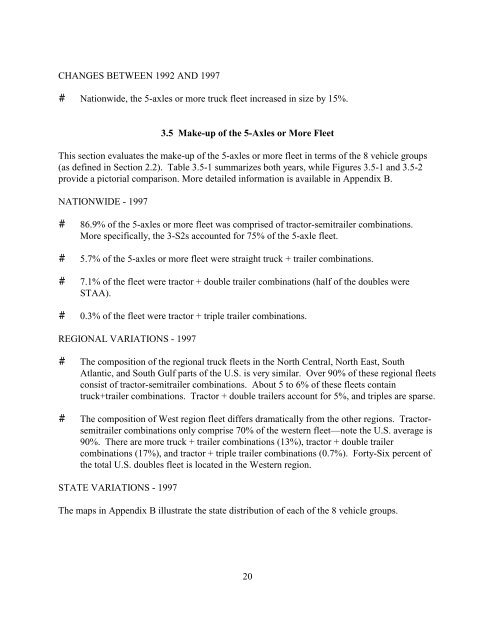
CHANGES BETWEEN 1992 AND 1997<br />
# Nationwide, <strong>the</strong> 5-axles or more truck fleet increased in size by 15%.<br />
3.5 Make-up <strong>of</strong> <strong>the</strong> 5-Axles or More Fleet<br />
This section evaluates <strong>the</strong> make-up <strong>of</strong> <strong>the</strong> 5-axles or more fleet in terms <strong>of</strong> <strong>the</strong> 8 vehicle groups<br />
(as defined in Section 2.2). Table 3.5-1 summarizes both years, while Figures 3.5-1 <strong>and</strong> 3.5-2<br />
provide a pictorial comparison. More detailed in<strong>for</strong>mation is available in Appendix B.<br />
NATIONWIDE - 1997<br />
# 86.9% <strong>of</strong> <strong>the</strong> 5-axles or more fleet was comprised <strong>of</strong> tractor-semitrailer combinations.<br />
More specifically, <strong>the</strong> 3-S2s accounted <strong>for</strong> 75% <strong>of</strong> <strong>the</strong> 5-axle fleet.<br />
# 5.7% <strong>of</strong> <strong>the</strong> 5-axles or more fleet were straight truck + trailer combinations.<br />
# 7.1% <strong>of</strong> <strong>the</strong> fleet were tractor + double trailer combinations (half <strong>of</strong> <strong>the</strong> doubles were<br />
STAA).<br />
# 0.3% <strong>of</strong> <strong>the</strong> fleet were tractor + triple trailer combinations.<br />
REGIONAL VARIATIONS - 1997<br />
# The composition <strong>of</strong> <strong>the</strong> regional truck fleets in <strong>the</strong> North Central, North East, South<br />
Atlantic, <strong>and</strong> South Gulf parts <strong>of</strong> <strong>the</strong> U.S. is very similar. Over 90% <strong>of</strong> <strong>the</strong>se regional fleets<br />
consist <strong>of</strong> tractor-semitrailer combinations. <strong>About</strong> 5 to 6% <strong>of</strong> <strong>the</strong>se fleets contain<br />
truck+trailer combinations. Tractor + double trailers account <strong>for</strong> 5%, <strong>and</strong> triples are sparse.<br />
# The composition <strong>of</strong> West region fleet differs dramatically from <strong>the</strong> o<strong>the</strong>r regions. Tractorsemitrailer<br />
combinations only comprise 70% <strong>of</strong> <strong>the</strong> western fleet—note <strong>the</strong> U.S. average is<br />
90%. There are more truck + trailer combinations (13%), tractor + double trailer<br />
combinations (17%), <strong>and</strong> tractor + triple trailer combinations (0.7%). Forty-Six percent <strong>of</strong><br />
<strong>the</strong> total U.S. doubles fleet is located in <strong>the</strong> Western region.<br />
STATE VARIATIONS - 1997<br />
The maps in Appendix B illustrate <strong>the</strong> state distribution <strong>of</strong> each <strong>of</strong> <strong>the</strong> 8 vehicle groups.<br />
20


