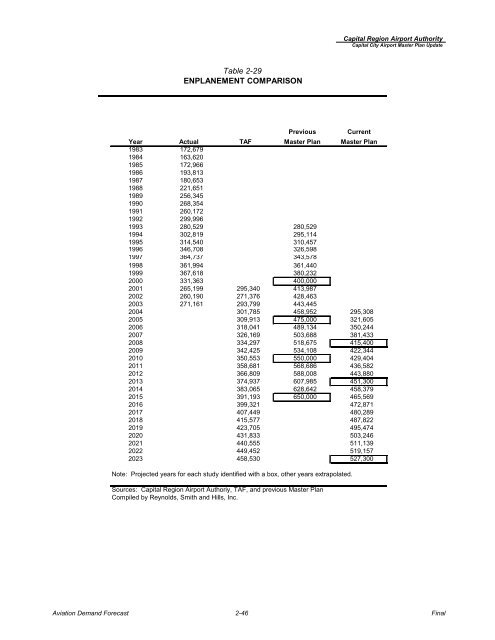
Table 2-29 ENPLANEMENT COMPARISON Previous Current Year Actual TAF <strong>Master</strong> <strong>Plan</strong> <strong>Master</strong> <strong>Plan</strong> 1983 172,679 1984 163,620 1985 172,966 1986 193,813 1987 180,653 1988 221,651 1989 256,345 1990 268,354 1991 260,172 1992 299,996 1993 280,529 280,529 1994 302,819 295,114 1995 314,540 310,457 1996 346,708 326,598 1997 364,737 343,578 1998 361,994 361,440 1999 367,618 380,232 2000 331,363 400,000 2001 265,199 295,340 413,987 2002 260,190 271,376 428,463 2003 271,161 293,799 443,445 2004 301,785 458,952 295,308 2005 309,913 475,000 321,605 2006 318,041 489,134 350,244 2007 326,169 503,688 381,433 2008 334,297 518,675 415,400 2009 342,425 534,108 422,344 2010 350,553 550,000 429,404 2011 358,681 568,686 436,582 2012 366,809 588,008 443,880 2013 374,937 607,985 451,300 2014 383,065 628,642 458,379 2015 391,193 650,000 465,569 2016 399,321 472,871 2017 407,449 480,289 2018 415,577 487,822 2019 423,705 495,474 2020 431,833 503,246 2021 440,555 511,139 2022 449,452 519,157 2023 458,530 527,300 Note: Projected years for each study identified with a box, other years extrapolated. Sources: <strong>Capital</strong> Region <strong>Airport</strong> Authoriy, TAF, and previous <strong>Master</strong> <strong>Plan</strong> Compiled by Reynolds, Smith and Hills, Inc. <strong>Capital</strong> Region <strong>Airport</strong> Authority <strong>Capital</strong> <strong>City</strong> <strong>Airport</strong> <strong>Master</strong> <strong>Plan</strong> <strong>Update</strong> Aviation Demand Forecast 2-46 Final
Table 2-30 OPERATIONS COMPARISON <strong>Capital</strong> Region <strong>Airport</strong> Authority <strong>Capital</strong> <strong>City</strong> <strong>Airport</strong> <strong>Master</strong> <strong>Plan</strong> <strong>Update</strong> Total Operations Commercial Service Operations <strong>Master</strong> <strong>Plan</strong> <strong>Master</strong> <strong>Plan</strong> Year Actual TAF MASP Previous Current Actual TAF Previous Current 1983 121,659 20,675 1984 115,217 19,749 1985 138,764 19,237 1986 147,242 22,104 1987 162,419 26,400 1988 159,874 29,072 1989 136,012 27,556 1990 145,614 31,835 1991 144,669 34,519 1992 150,775 36,102 1993 131,292 135,302 34,275 41,880 1994 134,640 138,527 41,518 42,686 1995 127,396 141,829 37,778 43,507 1996 114,532 145,210 39,153 44,345 1997 112,670 148,671 40,029 45,198 1998 113,566 152,215 39,695 46,068 1999 121,599 155,843 42,243 46,955 2000 120,228 160,000 42,708 50,000 2001 100,403 100,403 163,814 34,948 34,948 50,962 2002 97,934 97,934 93,802 167,719 28,857 28,857 51,943 2003 92,421 99,058 94,013 171,716 29,360 29,882 52,943 2004 99,776 94,224 175,809 96,332 30,500 53,962 32,284 2005 100,493 94,860 180,000 100,408 31,118 55,000 35,500 2006 101,209 95,765 182,905 104,656 31,736 55,966 39,036 2007 101,927 96,678 185,856 109,084 32,354 56,948 42,924 2008 102,646 97,600 188,856 113,700 32,973 57,948 47,200 2009 103,364 98,530 191,903 114,952 33,591 58,965 47,823 2010 104,083 99,470 195,000 116,218 34,210 60,000 48,455 2011 104,801 100,537 198,845 117,498 34,828 60,968 49,095 2012 105,519 101,615 202,766 118,792 35,446 61,952 49,743 2013 106,238 102,705 206,765 120,100 36,065 62,952 50,400 2014 106,956 103,807 210,842 121,194 36,683 63,968 50,833 2015 107,675 104,921 215,000 122,298 37,302 65,000 51,269 2016 108,393 106,046 123,412 37,920 51,710 2017 109,111 107,184 124,536 38,538 52,154 2018 109,830 108,333 125,671 39,157 52,602 2019 110,548 109,495 126,816 39,775 53,054 2020 111,267 110,670 127,971 40,394 53,509 2021 111,870 129,137 40,703 53,969 2022 112,477 130,313 41,014 54,432 2023 113,087 131,500 41,328 54,900 Note: Projected years for each study identified with a box, other years extrapolated. Sources: <strong>Capital</strong> Region <strong>Airport</strong> Authoriy, TAF, and previous <strong>Master</strong> <strong>Plan</strong> Compiled by Reynolds, Smith and Hills, Inc. Aviation Demand Forecast 2-47 Final
- Page 3:
Capital Region Airport Authority Ca
- Page 6 and 7:
Capital Region Airport Authority Ca
- Page 8 and 9:
Capital Region Airport Authority Ca
- Page 10 and 11:
Capital Region Airport Authority Ca
- Page 12 and 13:
Capital Region Airport Authority Ca
- Page 14 and 15:
List of Appendices Appendix A Gloss
- Page 16 and 17:
The forecast of aviation activity c
- Page 18 and 19:
• Provide designated areas for ca
- Page 20 and 21:
Environmental Considerations The en
- Page 22 and 23:
1.1 Introduction CHAPTER 1 INVENTOR
- Page 25 and 26:
1.1 Introduction CHAPTER 1 INVENTOR
- Page 27 and 28:
1.2.2.1 Location Exhibit 1-1 EXISTI
- Page 29 and 30:
Exhibit 1-3 REGIONAL MAP Capital Re
- Page 31 and 32:
Capital Region Airport Authority Ca
- Page 33 and 34:
Capital Region Airport Authority Ca
- Page 35 and 36:
1.2.3.3 Aviation Activity Overview
- Page 37 and 38:
Capital Region Airport Authority Ca
- Page 39 and 40:
1.3.1 Runways Exhibit 1-6 AIRSIDE F
- Page 41 and 42:
1.3.3 Visual Aids Exhibit 1-7 AIRPO
- Page 43 and 44:
Capital Region Airport Authority Ca
- Page 45 and 46:
Capital Region Airport Authority Ca
- Page 47 and 48:
Exhibit 1-9 FIRST FLOOR FUNCTIONAL
- Page 49 and 50:
Table 1-7 AIRLINE SPACE DISTRIBUTIO
- Page 51 and 52:
Table 1-9 CONCESSION SPACE DISTRIBU
- Page 53 and 54:
Table 1-12 GOVERNMENT SPACE DISTRIB
- Page 55 and 56:
1.4.3.1 Public Curb Exhibit 1-13 PA
- Page 57 and 58:
Table 1-14 GENERAL AVIATION BUILDIN
- Page 59 and 60:
1.6.2 Aircraft Rescue and Fire Figh
- Page 61 and 62:
Capital Region Airport Authority Ca
- Page 63 and 64:
• Off-airport access roads • On
- Page 65 and 66:
1.7.3.1 Public Parking Exhibit 1-18
- Page 67 and 68: 1.8.2 Land Use / Zoning Capital Reg
- Page 69 and 70: 1.10 Business Aspects Capital Regio
- Page 71 and 72: Concessions 9.6% Land Rentals 10.0%
- Page 73 and 74: CHAPTER 2 FORECAST OF AVIATION DEMA
- Page 75 and 76: 2.1.2 Airlines Serving the Airport
- Page 77 and 78: Capital Region Airport Authority Ca
- Page 79 and 80: Number of Enplanements 400,000 350,
- Page 81 and 82: Annual Operations 180,000 160,000 1
- Page 83 and 84: Millions of Pounds 70 60 50 40 30 2
- Page 85 and 86: 40.0% 30.0% 20.0% 10.0% 0.0% -10.0%
- Page 87 and 88: 2000 - 2023 1970 - 2000 2000 - 2023
- Page 89 and 90: Capital Region Airport Authority Ca
- Page 91 and 92: Capital Region Airport Authority Ca
- Page 93 and 94: 900 800 700 600 500 400 300 200 100
- Page 95 and 96: 2.3.3 Market Share Analysis Capital
- Page 97 and 98: 900,000 800,000 700,000 600,000 500
- Page 99 and 100: 600,000 500,000 400,000 300,000 200
- Page 101 and 102: Capital Region Airport Authority Ca
- Page 103 and 104: 2.4.2 Annual General Aviation Opera
- Page 105 and 106: 2.4.4 Itinerant and Local Operation
- Page 107 and 108: 2.5 Forecast of Enplaned Cargo Capi
- Page 109 and 110: 2.6 Based Aircraft Capital Region A
- Page 111 and 112: 2.7 Annual Instrument Approaches Ca
- Page 113 and 114: Percent of Total 12.5% 11.5% 10.5%
- Page 115 and 116: Percent of Total Capital Region Air
- Page 117: 2.9 Comparison with Other Forecast
- Page 121 and 122: Capital Region Airport Authority Ca
- Page 123: 2.10 Summary of Forecasts Capital R
- Page 126 and 127: Capital Region Airport Authority Ca
- Page 128 and 129: Capital Region Airport Authority Ca
- Page 130 and 131: Capital Region Airport Authority Ca
- Page 132 and 133: Exhibit 3-2 DEMAND CAPACITY CALCULA
- Page 134 and 135: Capital Region Airport Authority Ca
- Page 136 and 137: Capital Region Airport Authority Ca
- Page 138 and 139: Capital Region Airport Authority Ca
- Page 140 and 141: Capital Region Airport Authority Ca
- Page 142 and 143: L G Exhibit 3-3 TAXIWAY SYSTEM C M
- Page 144 and 145: Capital Region Airport Authority Ca
- Page 146 and 147: 3.4.3.4 Taxiway Lighting Capital Re
- Page 148 and 149: 3.6 Terminal Area Requirements Capi
- Page 150 and 151: Capital Region Airport Authority Ca
- Page 152 and 153: Capital Region Airport Authority Ca
- Page 154 and 155: 3.6.1.3 Terminal Expansion Options
- Page 156 and 157: Capital Region Airport Authority Ca
- Page 158 and 159: Capital Region Airport Authority Ca
- Page 160 and 161: Table 3-23 SHORT AND LONG TERM PUBL
- Page 162 and 163: Table 3-25 RENTAL CAR REQUIREMENTS
- Page 164 and 165: 3.7.2 Aircraft Apron Table 3-26 HAN
- Page 166 and 167: Capital Region Airport Authority Ca
- Page 168 and 169:
Capital Region Airport Authority Ca
- Page 170 and 171:
Capital Region Airport Authority Ca
- Page 172 and 173:
Capital Region Airport Authority Ca
- Page 174 and 175:
Capital Region Airport Authority Ca
- Page 176 and 177:
3.10.2.1 Curbfront Traffic Demand E
- Page 178 and 179:
Exhibit 3-6 TERMINAL CURBFRONT LANE
- Page 180 and 181:
3.11 Land Requirements Capital Regi
- Page 182 and 183:
3.17 Summary Capital Region Airport
- Page 184 and 185:
Capital Region Airport Authority Ca
- Page 186 and 187:
Capital Region Airport Authority Ca
- Page 188 and 189:
Parallel Taxiway Terminal Redevelop
- Page 190 and 191:
4.3 Leading Elements Based on the f
- Page 192 and 193:
Exhibit 4-3 LEADING ELEMENTS ALTERN
- Page 194 and 195:
Capital Region Airport Authority Ca
- Page 196 and 197:
Capital Region Airport Authority Ca
- Page 198 and 199:
Capital Region Airport Authority Ca
- Page 200 and 201:
Table 4-4 PASSENGER ORIGIN LOCATION
- Page 202 and 203:
Capital Region Airport Authority Ca
- Page 204 and 205:
A. Existing Terminal Access Capital
- Page 206 and 207:
4.3.5.5 Implementation Capital Regi
- Page 208 and 209:
Table 4-5 LEADING ELEMENT ALTERNATI
- Page 210 and 211:
Table 4-7 LEADING ELEMENT ALTERNATI
- Page 213 and 214:
Capital Region Airport Authority Ca
- Page 215 and 216:
4.4.2 Aviation Support Facilities E
- Page 217 and 218:
Capital Region Airport Authority Ca
- Page 219 and 220:
Capital Region Airport Authority Ca
- Page 221 and 222:
Capital Region Airport Authority Ca
- Page 223:
Parallel Taxiway Terminal Redevelop
- Page 226 and 227:
Capital Region Airport Authority Ca
- Page 228 and 229:
Capital Region Airport Authority Ca
- Page 230 and 231:
Capital Region Airport Authority Ca
- Page 232 and 233:
Capital Region Airport Authority Ca
- Page 234 and 235:
Capital Region Airport Authority Ca
- Page 236 and 237:
Capital Region Airport Authority Ca
- Page 238 and 239:
Capital Region Airport Authority Ca
- Page 240 and 241:
• FAA Advisory Circular 150/5070-
- Page 242 and 243:
Object Table 6-1 OBJECTS AND FEATUR
- Page 244 and 245:
• Glide Slope Design Standard Com
- Page 271:
EXISTING RUNWAY 24 OBSTRUCTIONS SUM
- Page 283:
NOTES ● PROPERTY LISTED BY LOCATI
- Page 286 and 287:
• Additional employee parking, re
- Page 288 and 289:
Capital Region Airport Authority Ca
- Page 290 and 291:
Table 7-1 HISTORICAL CASH FLOW Capi
- Page 292 and 293:
Capital Region Airport Authority Ca
- Page 294 and 295:
$90,000,000 $80,000,000 $70,000,000
- Page 296 and 297:
Capital Region Airport Authority Ca
- Page 298 and 299:
Capital Region Airport Authority Ca
- Page 300 and 301:
Table 7-6 PROFORMA CASH FLOW (Page
- Page 302 and 303:
Table 7-6 PROFORMA CASH FLOW (Page
- Page 304:
Capital Region Airport Authority Ca