Master Plan Update (pdf) - Lansing/Capital City Airport
Master Plan Update (pdf) - Lansing/Capital City Airport
Master Plan Update (pdf) - Lansing/Capital City Airport

Create successful ePaper yourself
Turn your PDF publications into a flip-book with our unique Google optimized e-Paper software.
2.3.2 Econometric and Socioeconomic Regression Analysis<br />
<strong>Capital</strong> Region <strong>Airport</strong> Authority<br />
<strong>Capital</strong> <strong>City</strong> <strong>Airport</strong> <strong>Master</strong> <strong>Plan</strong> <strong>Update</strong><br />
Several local socioeconomic indicators were reviewed and tested to determine if a statistically<br />
significant relationship exists between historical enplanements at <strong>Capital</strong> <strong>City</strong> <strong>Airport</strong> and the<br />
selected indicators for the ASA. The indicators reviewed in this analysis included: population,<br />
employment, per capita personal income (PCPI), and airline yields. Two different scenarios were<br />
examined for the US carriers’ domestic yield. Scenario 1 assumed that the airlines’ yield would<br />
continue to decline based on an extension of the FAA’s yield projections. Scenario 2 assumed that<br />
the airlines’ yield would increase from the recession lowered 2002 level to the pre-recession 2000<br />
level and decline thereafter to 7.5 cents per mile. Historical data and projections of these<br />
socioeconomic indicators were taken from the Woods and Poole 2003 MSA Profile.<br />
The statistical significance of projections produced by a regression analysis is assessed using the<br />
coefficient of determination, or R 2 value. The R 2 value is the square of the correlation coefficient<br />
and measures the contribution of the independent variables in the prediction of the dependent<br />
variable. The R 2 value will range between 0.00 and 1.00 with 1.00 indicating a perfect correlation<br />
between the independent and dependent variables. R 2 values of less than 0.70 generally indicate<br />
there is little correlation between the two variables.<br />
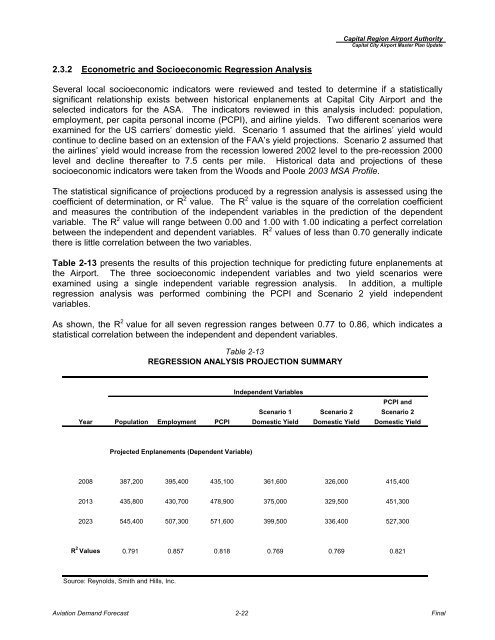
Table 2-13 presents the results of this projection technique for predicting future enplanements at<br />
the <strong>Airport</strong>. The three socioeconomic independent variables and two yield scenarios were<br />
examined using a single independent variable regression analysis. In addition, a multiple<br />
regression analysis was performed combining the PCPI and Scenario 2 yield independent<br />
variables.<br />
As shown, the R 2 value for all seven regression ranges between 0.77 to 0.86, which indicates a<br />
statistical correlation between the independent and dependent variables.<br />
Independent Variables<br />
Scenario 1 Scenario 2<br />
PCPI and<br />
Scenario 2<br />
Year Population Employment PCPI Domestic Yield Domestic Yield Domestic Yield<br />
Projected Enplanements (Dependent Variable)<br />
2008 387,200 395,400 435,100 361,600 326,000 415,400<br />
2013 435,800 430,700 478,900 375,000 329,500 451,300<br />
2023 545,400 507,300 571,600 399,500 336,400 527,300<br />
R 2 Values 0.791 0.857 0.818 0.769 0.769 0.821<br />
Source: Reynolds, Smith and Hills, Inc.<br />
Table 2-13<br />
REGRESSION ANALYSIS PROJECTION SUMMARY<br />
Aviation Demand Forecast 2-22 Final