Master Plan Update (pdf) - Lansing/Capital City Airport
Master Plan Update (pdf) - Lansing/Capital City Airport
Master Plan Update (pdf) - Lansing/Capital City Airport

You also want an ePaper? Increase the reach of your titles
YUMPU automatically turns print PDFs into web optimized ePapers that Google loves.
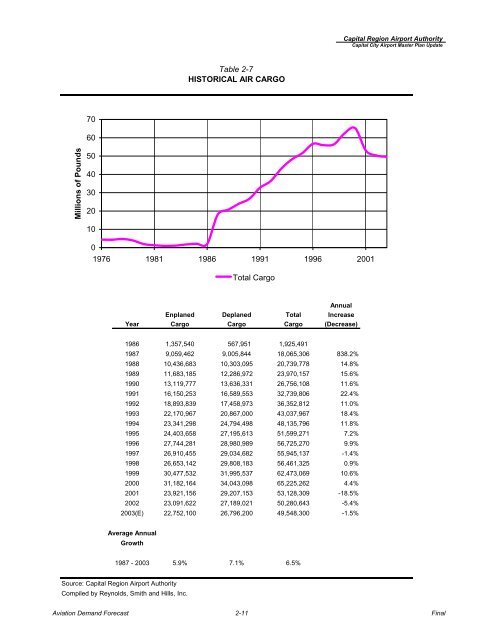
Millions of Pounds<br />
70<br />
60<br />
50<br />
40<br />
30<br />
20<br />
10<br />
Table 2-7<br />
HISTORICAL AIR CARGO<br />
0<br />
1976 1981 1986 1991 1996 2001<br />
Annual<br />
Enplaned Deplaned Total Increase<br />
Year Cargo Cargo Cargo (Decrease)<br />
1986 1,357,540 567,951 1,925,491<br />
1987 9,059,462 9,005,844 18,065,306 838.2%<br />
1988 10,436,683 10,303,095 20,739,778 14.8%<br />
1989 11,683,185 12,286,972 23,970,157 15.6%<br />
1990 13,119,777 13,636,331 26,756,108 11.6%<br />
1991 16,150,253 16,589,553 32,739,806 22.4%<br />
1992 18,893,839 17,458,973 36,352,812 11.0%<br />
1993 22,170,967 20,867,000 43,037,967 18.4%<br />
1994 23,341,298 24,794,498 48,135,796 11.8%<br />
1995 24,403,658 27,195,613 51,599,271 7.2%<br />
1996 27,744,281 28,980,989 56,725,270 9.9%<br />
1997 26,910,455 29,034,682 55,945,137 -1.4%<br />
1998 26,653,142 29,808,183 56,461,325 0.9%<br />
1999 30,477,532 31,995,537 62,473,069 10.6%<br />
2000 31,182,164 34,043,098 65,225,262 4.4%<br />
2001 23,921,156 29,207,153 53,128,309 -18.5%<br />
2002 23,091,622 27,189,021 50,280,643 -5.4%<br />
2003(E) 22,752,100 26,796,200 49,548,300 -1.5%<br />
Average Annual<br />
Growth<br />
1987 - 2003 5.9% 7.1% 6.5%<br />
Source: <strong>Capital</strong> Region <strong>Airport</strong> Authority<br />
Compiled by Reynolds, Smith and Hills, Inc.<br />
Total Cargo<br />
<strong>Capital</strong> Region <strong>Airport</strong> Authority<br />
<strong>Capital</strong> <strong>City</strong> <strong>Airport</strong> <strong>Master</strong> <strong>Plan</strong> <strong>Update</strong><br />
Aviation Demand Forecast 2-11 Final