<strong>Capital</strong> Region <strong>Airport</strong> Authority <strong>Capital</strong> <strong>City</strong> <strong>Airport</strong> <strong>Master</strong> <strong>Plan</strong> <strong>Update</strong> As shown in Table 7-2, total inflated costs for the short-term development is estimated at $32.9 million. The following funding sources have been identified to pay for the total cost of these projects: · Federal Aviation Administration (FAA) $25.5 million · MDOT $1.2 million · Third Party $1.2 million · Local $5.1 million Table 7-2 SHORT-TERM CAPITAL IMPROVEMENT PROGRAM Total Inflated Third Year Item Description Total Cost Cost Federal State Party Local 2006 1 Long-Term Parking Phase 1 $975,000 $1,004,000 $0 $0 $0 $1,004,000 2006 2 Extend RW 28L - 750 feet Phase 1 4,800,000 4,944,000 4,696,800 0 0 247,200 Yearly Sub-Total $5,775,000 $5,948,000 $4,696,800 $0 $1,251,200 2007 3 Runway 28L Extension - 1250 Ft. $0 $0 $0 $0 $0 $0 2007 4 Extend RW 28L - 500 feet Phase 2 11,700,000 12,413,000 11,792,350 310,325 0 310,325 2007 5 Install 4 Loading Bridges 1,150,000 1,220,000 1,159,000 30,500 0 30,500 2007 6 Resurface TW A/Air Carrier Ramp 531,700 564,000 535,800 14,100 0 14,100 2007 7 Construct TW to East Ramp 400,000 424,000 402,800 10,600 0 10,600 2007 8 Lower Level Security, Circulation, Concessio 815,000 865,000 821,750 21,625 0 21,625 2007 9 Ticket Lobby Security 235,000 249,000 236,550 6,225 0 6,225 2007 10 Second Level Secure Concessions 60,000 64,000 60,800 1,600 0 1,600 2007 11 Rental Car Counters/Offices 5,000 5,000 0 0 0 5,000 2007 12 Bag Claim 237,500 252,000 239,400 6,300 0 6,300 2007 13 FIS 3,000,000 3,183,000 3,023,850 79,575 0 79,575 Yearly Sub-Total $18,134,200 $19,239,000 $18,272,300 $480,850 $485,850 2008 14 Long-Term Parking Phase 2 $2,475,000 $2,704,000 $0 $67,600 $0 $2,636,400 2008 15 T-Hangars - 8 ea. 350,000 382,000 0 0 382,000 0 2008 16 Conventional Hangars - 8 ea. 750,000 820,000 0 0 820,000 0 2008 17 GA Apron - 3,000 SY 281,250 307,000 276,300 0 0 30,700 2008 18 GA Taxilanes 412,781 451,000 405,900 0 0 45,100 2008 19 Cargo Apron - 7,500 SY 843,750 922,000 829,800 0 0 92,200 2008 20 Land Acquisition for Future Development 1,000,000 1,093,000 983,700 0 0 109,300 2008 21 Cargo Landside Area - 3,400 SY 318,750 348,000 0 0 0 348,000 2008 22 Fuel Storage 650,000 710,000 0 639,000 0 71,000 Yearly Sub-Total $7,081,531 $7,737,000 $2,495,700 $706,600 $1,202,000 $3,332,700 Short-Term Development Total $30,990,731 $32,924,000 $25,464,800 $1,187,450 $1,202,000 $5,069,750 It should be noted that the actual timing of development should be re-assessed each year based on both availability of funds, as well as actual need and demand for facilities and improvements. The CIP and funding sources for the long-term development are presented in Table 7-3 and Exhibit 7-2. Implementation <strong>Plan</strong> 7-8 Final
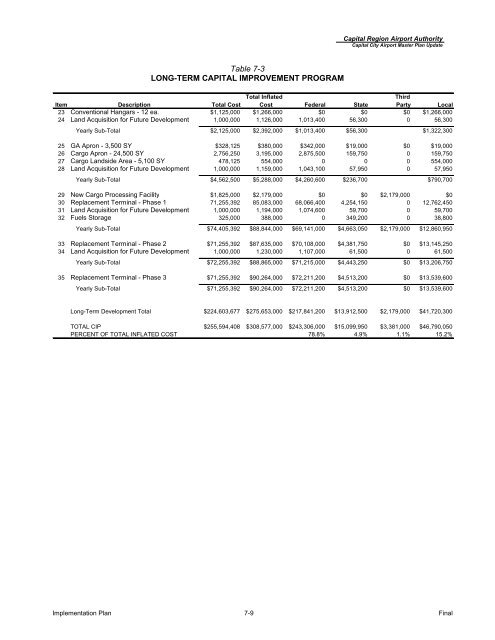
Table 7-3 LONG-TERM CAPITAL IMPROVEMENT PROGRAM <strong>Capital</strong> Region <strong>Airport</strong> Authority <strong>Capital</strong> <strong>City</strong> <strong>Airport</strong> <strong>Master</strong> <strong>Plan</strong> <strong>Update</strong> Total Inflated Third Item Description Total Cost Cost Federal State Party Local 23 Conventional Hangars - 12 ea. $1,125,000 $1,266,000 $0 $0 $0 $1,266,000 24 Land Acquisition for Future Development 1,000,000 1,126,000 1,013,400 56,300 0 56,300 Yearly Sub-Total $2,125,000 $2,392,000 $1,013,400 $56,300 $1,322,300 25 GA Apron - 3,500 SY $328,125 $380,000 $342,000 $19,000 $0 $19,000 26 Cargo Apron - 24,500 SY 2,756,250 3,195,000 2,875,500 159,750 0 159,750 27 Cargo Landside Area - 5,100 SY 478,125 554,000 0 0 0 554,000 28 Land Acquisition for Future Development 1,000,000 1,159,000 1,043,100 57,950 0 57,950 Yearly Sub-Total $4,562,500 $5,288,000 $4,260,600 $236,700 $790,700 29 New Cargo Processing Facility $1,825,000 $2,179,000 $0 $0 $2,179,000 $0 30 Replacement Terminal - Phase 1 71,255,392 85,083,000 68,066,400 4,254,150 0 12,762,450 31 Land Acquisition for Future Development 1,000,000 1,194,000 1,074,600 59,700 0 59,700 32 Fuels Storage 325,000 388,000 0 349,200 0 38,800 Yearly Sub-Total $74,405,392 $88,844,000 $69,141,000 $4,663,050 $2,179,000 $12,860,950 33 Replacement Terminal - Phase 2 $71,255,392 $87,635,000 $70,108,000 $4,381,750 $0 $13,145,250 34 Land Acquisition for Future Development 1,000,000 1,230,000 1,107,000 61,500 0 61,500 Yearly Sub-Total $72,255,392 $88,865,000 $71,215,000 $4,443,250 $0 $13,206,750 35 Replacement Terminal - Phase 3 $71,255,392 $90,264,000 $72,211,200 $4,513,200 $0 $13,539,600 Yearly Sub-Total $71,255,392 $90,264,000 $72,211,200 $4,513,200 $0 $13,539,600 Long-Term Development Total $224,603,677 $275,653,000 $217,841,200 $13,912,500 $2,179,000 $41,720,300 TOTAL CIP $255,594,408 $308,577,000 $243,306,000 $15,099,950 $3,381,000 $46,790,050 PERCENT OF TOTAL INFLATED COST 78.8% 4.9% 1.1% 15.2% Implementation <strong>Plan</strong> 7-9 Final
- Page 3:
Capital Region Airport Authority Ca
- Page 6 and 7:
Capital Region Airport Authority Ca
- Page 8 and 9:
Capital Region Airport Authority Ca
- Page 10 and 11:
Capital Region Airport Authority Ca
- Page 12 and 13:
Capital Region Airport Authority Ca
- Page 14 and 15:
List of Appendices Appendix A Gloss
- Page 16 and 17:
The forecast of aviation activity c
- Page 18 and 19:
• Provide designated areas for ca
- Page 20 and 21:
Environmental Considerations The en
- Page 22 and 23:
1.1 Introduction CHAPTER 1 INVENTOR
- Page 25 and 26:
1.1 Introduction CHAPTER 1 INVENTOR
- Page 27 and 28:
1.2.2.1 Location Exhibit 1-1 EXISTI
- Page 29 and 30:
Exhibit 1-3 REGIONAL MAP Capital Re
- Page 31 and 32:
Capital Region Airport Authority Ca
- Page 33 and 34:
Capital Region Airport Authority Ca
- Page 35 and 36:
1.2.3.3 Aviation Activity Overview
- Page 37 and 38:
Capital Region Airport Authority Ca
- Page 39 and 40:
1.3.1 Runways Exhibit 1-6 AIRSIDE F
- Page 41 and 42:
1.3.3 Visual Aids Exhibit 1-7 AIRPO
- Page 43 and 44:
Capital Region Airport Authority Ca
- Page 45 and 46:
Capital Region Airport Authority Ca
- Page 47 and 48:
Exhibit 1-9 FIRST FLOOR FUNCTIONAL
- Page 49 and 50:
Table 1-7 AIRLINE SPACE DISTRIBUTIO
- Page 51 and 52:
Table 1-9 CONCESSION SPACE DISTRIBU
- Page 53 and 54:
Table 1-12 GOVERNMENT SPACE DISTRIB
- Page 55 and 56:
1.4.3.1 Public Curb Exhibit 1-13 PA
- Page 57 and 58:
Table 1-14 GENERAL AVIATION BUILDIN
- Page 59 and 60:
1.6.2 Aircraft Rescue and Fire Figh
- Page 61 and 62:
Capital Region Airport Authority Ca
- Page 63 and 64:
• Off-airport access roads • On
- Page 65 and 66:
1.7.3.1 Public Parking Exhibit 1-18
- Page 67 and 68:
1.8.2 Land Use / Zoning Capital Reg
- Page 69 and 70:
1.10 Business Aspects Capital Regio
- Page 71 and 72:
Concessions 9.6% Land Rentals 10.0%
- Page 73 and 74:
CHAPTER 2 FORECAST OF AVIATION DEMA
- Page 75 and 76:
2.1.2 Airlines Serving the Airport
- Page 77 and 78:
Capital Region Airport Authority Ca
- Page 79 and 80:
Number of Enplanements 400,000 350,
- Page 81 and 82:
Annual Operations 180,000 160,000 1
- Page 83 and 84:
Millions of Pounds 70 60 50 40 30 2
- Page 85 and 86:
40.0% 30.0% 20.0% 10.0% 0.0% -10.0%
- Page 87 and 88:
2000 - 2023 1970 - 2000 2000 - 2023
- Page 89 and 90:
Capital Region Airport Authority Ca
- Page 91 and 92:
Capital Region Airport Authority Ca
- Page 93 and 94:
900 800 700 600 500 400 300 200 100
- Page 95 and 96:
2.3.3 Market Share Analysis Capital
- Page 97 and 98:
900,000 800,000 700,000 600,000 500
- Page 99 and 100:
600,000 500,000 400,000 300,000 200
- Page 101 and 102:
Capital Region Airport Authority Ca
- Page 103 and 104:
2.4.2 Annual General Aviation Opera
- Page 105 and 106:
2.4.4 Itinerant and Local Operation
- Page 107 and 108:
2.5 Forecast of Enplaned Cargo Capi
- Page 109 and 110:
2.6 Based Aircraft Capital Region A
- Page 111 and 112:
2.7 Annual Instrument Approaches Ca
- Page 113 and 114:
Percent of Total 12.5% 11.5% 10.5%
- Page 115 and 116:
Percent of Total Capital Region Air
- Page 117 and 118:
2.9 Comparison with Other Forecast
- Page 119 and 120:
Table 2-30 OPERATIONS COMPARISON Ca
- Page 121 and 122:
Capital Region Airport Authority Ca
- Page 123:
2.10 Summary of Forecasts Capital R
- Page 126 and 127:
Capital Region Airport Authority Ca
- Page 128 and 129:
Capital Region Airport Authority Ca
- Page 130 and 131:
Capital Region Airport Authority Ca
- Page 132 and 133:
Exhibit 3-2 DEMAND CAPACITY CALCULA
- Page 134 and 135:
Capital Region Airport Authority Ca
- Page 136 and 137:
Capital Region Airport Authority Ca
- Page 138 and 139:
Capital Region Airport Authority Ca
- Page 140 and 141:
Capital Region Airport Authority Ca
- Page 142 and 143:
L G Exhibit 3-3 TAXIWAY SYSTEM C M
- Page 144 and 145:
Capital Region Airport Authority Ca
- Page 146 and 147:
3.4.3.4 Taxiway Lighting Capital Re
- Page 148 and 149:
3.6 Terminal Area Requirements Capi
- Page 150 and 151:
Capital Region Airport Authority Ca
- Page 152 and 153:
Capital Region Airport Authority Ca
- Page 154 and 155:
3.6.1.3 Terminal Expansion Options
- Page 156 and 157:
Capital Region Airport Authority Ca
- Page 158 and 159:
Capital Region Airport Authority Ca
- Page 160 and 161:
Table 3-23 SHORT AND LONG TERM PUBL
- Page 162 and 163:
Table 3-25 RENTAL CAR REQUIREMENTS
- Page 164 and 165:
3.7.2 Aircraft Apron Table 3-26 HAN
- Page 166 and 167:
Capital Region Airport Authority Ca
- Page 168 and 169:
Capital Region Airport Authority Ca
- Page 170 and 171:
Capital Region Airport Authority Ca
- Page 172 and 173:
Capital Region Airport Authority Ca
- Page 174 and 175:
Capital Region Airport Authority Ca
- Page 176 and 177:
3.10.2.1 Curbfront Traffic Demand E
- Page 178 and 179:
Exhibit 3-6 TERMINAL CURBFRONT LANE
- Page 180 and 181:
3.11 Land Requirements Capital Regi
- Page 182 and 183:
3.17 Summary Capital Region Airport
- Page 184 and 185:
Capital Region Airport Authority Ca
- Page 186 and 187:
Capital Region Airport Authority Ca
- Page 188 and 189:
Parallel Taxiway Terminal Redevelop
- Page 190 and 191:
4.3 Leading Elements Based on the f
- Page 192 and 193:
Exhibit 4-3 LEADING ELEMENTS ALTERN
- Page 194 and 195:
Capital Region Airport Authority Ca
- Page 196 and 197:
Capital Region Airport Authority Ca
- Page 198 and 199:
Capital Region Airport Authority Ca
- Page 200 and 201:
Table 4-4 PASSENGER ORIGIN LOCATION
- Page 202 and 203:
Capital Region Airport Authority Ca
- Page 204 and 205:
A. Existing Terminal Access Capital
- Page 206 and 207:
4.3.5.5 Implementation Capital Regi
- Page 208 and 209:
Table 4-5 LEADING ELEMENT ALTERNATI
- Page 210 and 211:
Table 4-7 LEADING ELEMENT ALTERNATI
- Page 213 and 214:
Capital Region Airport Authority Ca
- Page 215 and 216:
4.4.2 Aviation Support Facilities E
- Page 217 and 218:
Capital Region Airport Authority Ca
- Page 219 and 220:
Capital Region Airport Authority Ca
- Page 221 and 222:
Capital Region Airport Authority Ca
- Page 223:
Parallel Taxiway Terminal Redevelop
- Page 226 and 227:
Capital Region Airport Authority Ca
- Page 228 and 229:
Capital Region Airport Authority Ca
- Page 230 and 231:
Capital Region Airport Authority Ca
- Page 232 and 233:
Capital Region Airport Authority Ca
- Page 234 and 235:
Capital Region Airport Authority Ca
- Page 236 and 237:
Capital Region Airport Authority Ca
- Page 238 and 239:
Capital Region Airport Authority Ca
- Page 240 and 241:
• FAA Advisory Circular 150/5070-
- Page 242 and 243: Object Table 6-1 OBJECTS AND FEATUR
- Page 244 and 245: • Glide Slope Design Standard Com
- Page 271: EXISTING RUNWAY 24 OBSTRUCTIONS SUM
- Page 283: NOTES ● PROPERTY LISTED BY LOCATI
- Page 286 and 287: • Additional employee parking, re
- Page 288 and 289: Capital Region Airport Authority Ca
- Page 290 and 291: Table 7-1 HISTORICAL CASH FLOW Capi
- Page 294 and 295: $90,000,000 $80,000,000 $70,000,000
- Page 296 and 297: Capital Region Airport Authority Ca
- Page 298 and 299: Capital Region Airport Authority Ca
- Page 300 and 301: Table 7-6 PROFORMA CASH FLOW (Page
- Page 302 and 303: Table 7-6 PROFORMA CASH FLOW (Page
- Page 304: Capital Region Airport Authority Ca