Financial Report and Registration Document 2010 - Groupe Seb
Financial Report and Registration Document 2010 - Groupe Seb
Financial Report and Registration Document 2010 - Groupe Seb

You also want an ePaper? Increase the reach of your titles
YUMPU automatically turns print PDFs into web optimized ePapers that Google loves.
3<br />
CONSOLIDATED FINANCIAL STATEMENTS<br />
NOTES TO THE CONSOLIDATED FINANCIAL STATEMENTS<br />
(in € millions)<br />
ASSETS<br />
Carrying<br />
amount<br />
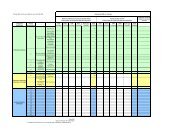
2009 <strong>Financial</strong> instruments by category<br />
Fair value<br />
At fair value<br />
through<br />
profit (excl.<br />
derivatives)<br />
Available for<br />
sale<br />
Loans <strong>and</strong><br />
receivables<br />
Held to<br />
maturity<br />
Derivative<br />
instruments<br />
Investments in non-consolidated companies 0.5 0.5 0.5<br />
Other non-current financial assets 7.3 7.3 7.3<br />
Other non-current assets 5.0 5.0 5.0<br />
Trade receivables 627.1 627.1 627.1<br />
Other current receivables,<br />
excl. prepaid expenses 44.3 44.3 44.3<br />
Derivative instruments 5.2 5.2 5.2<br />
Cash <strong>and</strong> cash equivalents 307.8 307.8 307.8<br />
TOTAL FINANCIAL ASSETS 997.2 997.2 307.8 0.5 683.7 5.2<br />
LIABILITIES<br />
Long-term borrowings 301.1 312.1 312.1<br />
Other non-current liabilities 23.7 23.7 23.7<br />
Trade payables 398.0 398.0 398.0<br />
Other current liabilities 195.7 195.7 195.7<br />
Derivative instruments 13.8 13.8 13.8<br />
Short-term borrowings 246.7 246.7 246.7<br />
TOTAL FINANCIAL LIABILITIES 1,179.0 1,190.0 1,176.2 13.8<br />
2008 <strong>Financial</strong> instruments by category<br />
At fair value<br />
through<br />
Carrying<br />
profit (excl. Available for Loans <strong>and</strong><br />
(in € millions)<br />
amount Fair value derivatives)<br />
sale receivables<br />
ASSETS<br />
Investments in non-consolidated companies 0.7 0.7 0.7<br />
Other non-current financial assets 9.9 9.9 9.9<br />
Other non-current assets 3.2 3.2 3.2<br />
Trade receivables 645.6 645.6 645.6<br />
Other current receivables,<br />
excl. prepaid expenses 46.0 46.0 46.0<br />
Held to<br />
maturity<br />
Derivative<br />
instruments<br />
Derivative instruments 12.0 12.0 12.0<br />
Cash <strong>and</strong> cash equivalents 224.6 224.6 224.6<br />
TOTAL FINANCIAL ASSETS 942.0 942.0 224.6 0.7 704.7 12.0<br />
LIABILITIES<br />
Long-term borrowings 213.5 213.5 213.5<br />
Other non-current liabilities 36.4 36.4 36.4<br />
Trade payables 366.3 366.3 366.3<br />
Other current liabilities 158.8 158.8 158.8<br />
Derivative instruments 51.2 51.2 51.2<br />
Short-term borrowings 661.5 660.6 660.6<br />
3<br />
TOTAL FINANCIAL LIABILITIES 1,487.7 1,486.8 1,435.6 51.2<br />
The fair value of trade <strong>and</strong> other receivables (classified as held-to-maturity<br />
investments) is equivalent to their carrying amount, in view of their short<br />
maturities.<br />
Non-current financial assets consist mainly of investments in non-consolidated<br />
companies, certain receivables related to those investments <strong>and</strong> operating<br />
receivables due beyond one year.<br />
<strong>Financial</strong> assets that are not quoted in an active market are recognised in the<br />
balance sheet at cost, which is representative of their fair value.<br />
Borrowings that are not quoted in an active market are measured by the<br />
discounted cash flows method, applied separately to each individual facility,<br />
based on market rates observed at the period-end for similar facilities <strong>and</strong><br />
the average spread obtained by the Group for its own issues.<br />
Other fi nancial liabilities consist mainly of accrued taxes <strong>and</strong> employee<br />
benefits expense, which are due within one year.<br />
GROUPE SEB<br />
FINANCIAL REPORT AND REGISTRATION DOCUMENT <strong>2010</strong><br />
103