Financial Report and Registration Document 2010 - Groupe Seb
Financial Report and Registration Document 2010 - Groupe Seb
Financial Report and Registration Document 2010 - Groupe Seb

Create successful ePaper yourself
Turn your PDF publications into a flip-book with our unique Google optimized e-Paper software.
3 NOTES<br />
CONSOLIDATED FINANCIAL STATEMENTS<br />
TO THE CONSOLIDATED FINANCIAL STATEMENTS<br />
NOTE 4<br />
OPERATING EXPENSES<br />
(in € millions) <strong>2010</strong> 2009 restated 2008 restated<br />
Purchased raw materials <strong>and</strong> goods (1,632.7) (1,414.1) (1,423.2)<br />
Labour costs (126.7) (125.4) (126.0)<br />
Freight costs (64.9) (22.1) (24.0)<br />
Other production costs (322.3) (305.4) (324.6)<br />
COST OF SALES (SUB-TOTAL) (2,146.6) (1,867.0) (1,897.8)<br />
Research <strong>and</strong> development costs (60.0) (50.0) (49.8)<br />
Advertising expense (143.0) (95.2) (119.8)<br />
Distribution <strong>and</strong> administrative expenses (864.3) (808.7) (820.9)<br />
OPERATING EXPENSES (3,213.9) (2,820.9) (2,888.5)<br />
As part of its migration to a new financial reporting application, the Group<br />
revamped its accounting plan, which resulted in certain expenses (mainly<br />
logistics expenses) being reclassifi ed in cost of sales. This changed the<br />
structure of gross margin, but had no impact on reported operating margin.<br />
NOTE 5<br />
EMPLOYEE BENEFITS EXPENSE<br />
(in € millions) <strong>2010</strong> 2009 2008<br />
Wages <strong>and</strong> salaries (excluding temporary staff costs) (429.3) (381.2) (384.1)<br />
Payroll taxes (112.6) (104.1) (105.0)<br />
Pension <strong>and</strong> other post-employment benefit plan costs (39.3) (38.3) (34.9)<br />
Service cost under defined benefit plans (7.6) (5.0) (5.3)<br />
Discretionary <strong>and</strong> non-discretionary profit-sharing (50.4) (33.5) (38.2)<br />
TOTAL EMPLOYEE BENEFITS EXPENSE (639.2) (562.1) (567.5)<br />
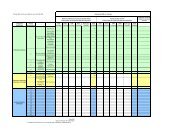
Breakdown by geographical<br />
segment <strong>2010</strong><br />
France<br />
Other Western<br />
European<br />
countries (a)<br />
North<br />
America<br />
South<br />
America<br />
Asia/<br />
Pacific<br />
Central Europe<br />
<strong>and</strong> other<br />
countries<br />
Employee benefits<br />
expense (excluding temporary staff costs) (368.3) (74.4) (41.5) (53.5) (77.2) (24.3) (639.2)<br />
Average number of employees 5,859 1,430 693 2,142 11,794 250 22,168<br />
Total<br />
Breakdown by geographical<br />
segment 2009<br />
France<br />
Other Western<br />
European<br />
countries (a)<br />
North<br />
America<br />
South<br />
America<br />
Asia/<br />
Pacific<br />
Central Europe<br />
<strong>and</strong> other<br />
countries<br />
Employee benefits<br />
expense (excluding temporary staff costs) (343.7) (72.9) (34.6) (39.1) (51.7) (20.1) (562.1)<br />
Average number of employees 6,077 1,461 638 1,997 9,313 227 19,713<br />
Total<br />
Breakdown by geographical<br />
segment 2008<br />
France<br />
Other Western<br />
European<br />
countries (a)<br />
North<br />
America<br />
South<br />
America<br />
Asia/<br />
Pacific<br />
Central Europe<br />
<strong>and</strong> other<br />
countries<br />
Employee benefits<br />
expense (excluding temporary staff costs) (344.8) (73.7) (35.6) (42.2) (52.4) (18.8) (567.5)<br />
Average number of employees 6,422 1,451 746 2,289 6,535 607 18,050<br />
(a) “Other Western European countries” correspond to the 15 other countries comprising the pre-enlargement European Union. The new EU countries are included in the “Central Europe <strong>and</strong><br />
other countries” segment.<br />
Total<br />
78 FINANCIAL REPORT AND REGISTRATION DOCUMENT <strong>2010</strong> GROUPE SEB