Financial Report and Registration Document 2010 - Groupe Seb
Financial Report and Registration Document 2010 - Groupe Seb
Financial Report and Registration Document 2010 - Groupe Seb

Create successful ePaper yourself
Turn your PDF publications into a flip-book with our unique Google optimized e-Paper software.
3<br />
CONSOLIDATED FINANCIAL STATEMENTS<br />
NOTES TO THE CONSOLIDATED FINANCIAL STATEMENTS<br />
NOTE 9<br />
EARNINGS PER SHARE<br />
(in € millions) <strong>2010</strong> 2009 2008<br />
Numerator<br />
Profit for the period 220.4 146.0 151.6<br />
After tax effect of dilutive potential shares<br />
Profit used to calculate diluted earnings per share 220.4 146.0 151.6<br />
Denominator<br />
Weighted average number of ordinary shares used to calculate basic<br />
earnings per share 47,414,375 46,476,548 47,325,540<br />
Effect of dilutive potential shares 1,000,136 86,774 366,772<br />
Weighted average number of ordinary shares used to calculate diluted<br />
earnings per share 48,414,511 46,563,322 47,692,312<br />
BASIC EARNINGS PER SHARE (IN €) 4.65 3.14 3.20<br />
DILUTED EARNINGS PER SHARE (IN €) 4.55 3.13 3.18<br />
The potential dilution is mainly due to the various stock option plans (see Note 19.2).<br />
NOTE 10<br />
INTANGIBLE ASSETS<br />
In accordance with IAS 38, intangible assets with an indefinite useful life –<br />
corresponding to trademarks <strong>and</strong> goodwill – are no longer amortised but<br />
are tested for impairment at each year-end. The impairment testing method<br />
is described in Note 1.4.<br />
Intangible assets with a finite useful life are amortised by the straight-line<br />
method over their estimated useful life. Amortisation expense is deducted<br />
from operating margin.<br />
The Group also holds certain trademarks – such as the Tefal international<br />
br<strong>and</strong> <strong>and</strong> the SEB <strong>and</strong> Calor regional br<strong>and</strong>s – which are not recognised<br />
in the balance sheet.<br />
3<br />
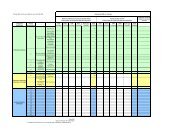
<strong>2010</strong><br />
(in € millions)<br />
Cost<br />
Patents <strong>and</strong><br />
licences Trademarks Goodwill Software<br />
Development<br />
costs Other Total<br />
At 1 January 19.1 304.0 406.4 55.8 43.0 59.3 887.6<br />
Acquisitions <strong>and</strong> additions 0.4 1.6 2.7 15.5 20.2<br />
Shares sold on the market (0.1) (20.4) (20.0) (1.7) (42.2)<br />
Other movements (a) 1.6 5.2 (7.1) (0.3)<br />
Translation adjustment 0.5 24.0 38.6 2.0 4.0 69.1<br />
AT 31 DECEMBER 19.9 328.0 445.0 40.6 30.9 70.1 934.5<br />
Depreciation <strong>and</strong> impairment losses<br />
At 1 January 16.4 6.6 19.8 43.5 31.8 10.7 128.8<br />
Translation adjustment 0.2 0.5 1.4 1.4 0.7 4.2<br />
Increases 0.3 6.0 7.9 5.0 19.2<br />
Impairment losses 14.7 14.7<br />
Depreciation <strong>and</strong> impairment losses<br />
written off on disposals (0.1) (20.4) (19.1) (39.6)<br />
Other movements (a) (0.6) (0.6)<br />
AT 31 DECEMBER 16.8 7.1 35.9 30.5 20.6 15.8 126.7<br />
Carrying amount at 1 January 2.7 297.4 386.6 12.3 11.2 48.6 758.8<br />
CARRYING AMOUNT<br />
AT 31 DECEMBER 3.1 320.9 409.1 10.1 10.3 54.3 807.8<br />
(a) Including changes in scope of consolidation.<br />
GROUPE SEB<br />
FINANCIAL REPORT AND REGISTRATION DOCUMENT <strong>2010</strong><br />
83