Financial Report and Registration Document 2010 - Groupe Seb
Financial Report and Registration Document 2010 - Groupe Seb
Financial Report and Registration Document 2010 - Groupe Seb

Create successful ePaper yourself
Turn your PDF publications into a flip-book with our unique Google optimized e-Paper software.
1<br />
GROUPE SEB IN <strong>2010</strong><br />
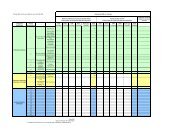
SOCIAL PERFORMANCE INDICATORS<br />
BREAKDOWN OF EMPLOYEES BY CATEGORY<br />
(Worldwide)<br />
(as a %) <strong>2010</strong> 2009 2008<br />
Direct manual labour 49.9 48.7 44.6<br />
Admin & office staff 40.5 41.3 44.4<br />
Managers 9.6 10.0 11.0<br />
1<br />
TOTAL 100 100 100<br />
Following the consolidation of Supor, the percentage of manual workers<br />
has gone up to nearly 50%. Excluding Supor, the percentage of direct<br />
manual labour dropped from 35.4% in 2009 to 34.5% in <strong>2010</strong> while<br />
that of managers increased: 16.41% in 2009 versus 17.15% in <strong>2010</strong>.<br />
The percentage of female managers also increased from 5.3% in 2009 to<br />
5.7% in <strong>2010</strong> (excluding Supor).<br />
BREAKDOWN OF CHANGES IN STAFFING<br />
(Worldwide excluding Supor)<br />
(number of individuals) <strong>2010</strong> 2009 2008<br />
RECRUITMENT (a) 2,136 1,289 1,921<br />
Fixed-term contracts 829 614 630<br />
Permanent contracts 1,307 675 1,291<br />
DEPARTURES (a) 1,795 1,974 2,505<br />
Economic redundancies 91 388 300<br />
Terminations for other reasons 238 216 429<br />
AVERAGE RATE OF STAFF TURNOVER (b) (%) 4.51 3.6 4.7<br />
(a) Excluding internal transfers.<br />
(b) Number of resignations of permanent contract employees/Average number of permanent employees in <strong>2010</strong>.<br />
Increased trading activity generated an increase in recruitment (+65.7% between 2009 <strong>and</strong> <strong>2010</strong>).<br />
BREAKDOWN OF EMPLOYEES BY TYPE OF CONTRACT<br />
(Worldwide)<br />
(as a %) <strong>2010</strong> 2009 2008<br />
PERMANENT CONTRACTS 50.4 56.1 63.0<br />
Full-time 91.7 91.8 92.5<br />
Part-time 8.3 8.2 7.5<br />
FIXED-TERM OR OTHER SHORT-TERM CONTRACTS 49 43.3 36.3<br />
Full-time 99.3 99.3 97.3<br />
Part-time 0.7 0.7 2.7<br />
APPRENTICESHIP 0.6 0.6 0.7<br />
TOTAL 100 100 100<br />
The integration of Supor <strong>and</strong> the rise in its employee population have<br />
generated an increase in fi xed-term or other short-term contracts, very<br />
common in China <strong>and</strong> particularly in manual labour.<br />
Excluding Supor, the percentage of employees with permanent contracts<br />
has been stable over the last three years <strong>and</strong> exceeds 92%.<br />
GROUPE SEB<br />
FINANCIAL REPORT AND REGISTRATION DOCUMENT <strong>2010</strong><br />
27