Financial Report and Registration Document 2010 - Groupe Seb
Financial Report and Registration Document 2010 - Groupe Seb
Financial Report and Registration Document 2010 - Groupe Seb

You also want an ePaper? Increase the reach of your titles
YUMPU automatically turns print PDFs into web optimized ePapers that Google loves.
3<br />
CONSOLIDATED FINANCIAL STATEMENTS<br />
FINANCIAL STATEMENTS<br />
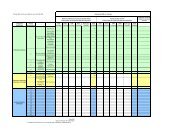
CONSOLIDATED STATEMENT OF CHANGES IN EQUITY<br />
(in € millions)<br />
Share<br />
capital<br />
Share<br />
premium<br />
account<br />
Reserves<br />
<strong>and</strong> retained<br />
earnings<br />
Translation<br />
reserve<br />
Treasury<br />
stock<br />
Equity<br />
attributable<br />
to owners of<br />
the parent<br />
Noncontrolling<br />
interests<br />
AT 31 DECEMBER 2007 50.9 107.3 798.2 16.2 (108.6) 864.0 0.0 864.0<br />
Profit/(loss) for the period 151.6 151.6 11.2 162.8<br />
Other comprehensive income (35.3) 9.3 (26.0) 14.6 (11.4)<br />
Comprehensive income 0.0 0.0 116.3 9.3 0.0 125.6 25.8 151.4<br />
Dividends paid (46.1) (46.1) (0.2) (46.3)<br />
Issue of share capital 0.6 0.6 0.6<br />
Reduction of share capital 0.0 0.0<br />
Changes in treasury stock (42.1) (42.1) (42.1)<br />
Gains (losses) on sales of treasury stock,<br />
after tax (1.0) (1.0) (1.0)<br />
Exercise of stock options 5.9 5.9 1.3 7.2<br />
Other movements (a) (1.0) (1.0) 104.7 103.7<br />
AT 31 DECEMBER 2008 50.9 107.9 872.3 25.5 (150.7) 905.9 131.6 1,037.5<br />
Profit/(loss) for the period 145.9 145.9 16.9 162.8<br />
Other comprehensive income 41.7 13.0 54.7 (4.8) 49.9<br />
Comprehensive income 0.0 0.0 187.6 13.0 0.0 200.6 12.1 212.7<br />
Dividends paid (45.4) (45.4) (4.8) (50.2)<br />
Issue of share capital 0.7 0.7 0.7<br />
Reduction of share capital 0.0 0.0<br />
Changes in treasury stock (0.9) (29.7) 41.9 11.3 11.3<br />
Gains (losses) on sales of treasury stock,<br />
after tax (2.5) (2.5) (2.5)<br />
Exercise of stock options 6.0 6.0 6.0<br />
Other movements 4.7 4.7 (0.1) 4.6<br />
AT 31 DECEMBER 2009 (NOTE 19) 50.0 78.9 1,022.7 38.5 (108.8) 1,081.3 138.8 1,220.1<br />
2009 recommended dividend 0.0<br />
At 31 December 2009 after appropriation 50.0 78.9 1,022.7 38.5 (108.8) 1,081.3 138.8 1,220.1<br />
Profit/(loss) for the period 220.4 220.4 23.2 243.6<br />
Other comprehensive income 7.6 95.8 103.4 15.8 119.2<br />
Comprehensive income 0.0 0.0 228.0 95.8 0.0 323.8 39.0 362.8<br />
Dividends paid (51.2) (51.2) (4.7) (55.9)<br />
Issue of share capital 0.0 0.0<br />
Reduction of share capital 0.0 0.0<br />
Changes in treasury stock 47.1 47.1 47.1<br />
Gains (losses) on sales of treasury stock,<br />
after tax (9.0) (9.0) (9.0)<br />
Exercise of stock options 6.2 6.2 6.2<br />
Other movements (1.4) 1.4 0.0 0.0<br />
AT 31 DECEMBER <strong>2010</strong> (NOTE 19) 50.0 78.9 1,195.3 135.7 (61.7) 1,398.2 173.1 1,571.3<br />
<strong>2010</strong> recommended dividend (59) (59) (59)<br />
AT 31 DECEMBER <strong>2010</strong> AFTER<br />
APPROPRIATION 50.0 78.9 1,136.3 135.7 (61.7) 1,339.2 173.1 1,512.3<br />
Equity<br />
3<br />
(a) “’Other movements” for 2008 mainly correspond to non-controlling interests in ZJ Supor, which was fully consolidated as from 1 January 2008.<br />
GROUPE SEB<br />
FINANCIAL REPORT AND REGISTRATION DOCUMENT <strong>2010</strong><br />
65